Clustering
Aaron Meyer (based on slides from David Sontag)
Clustering
- Unsupervised learning
- Requires data, but no labels
- Detect patterns e.g. in
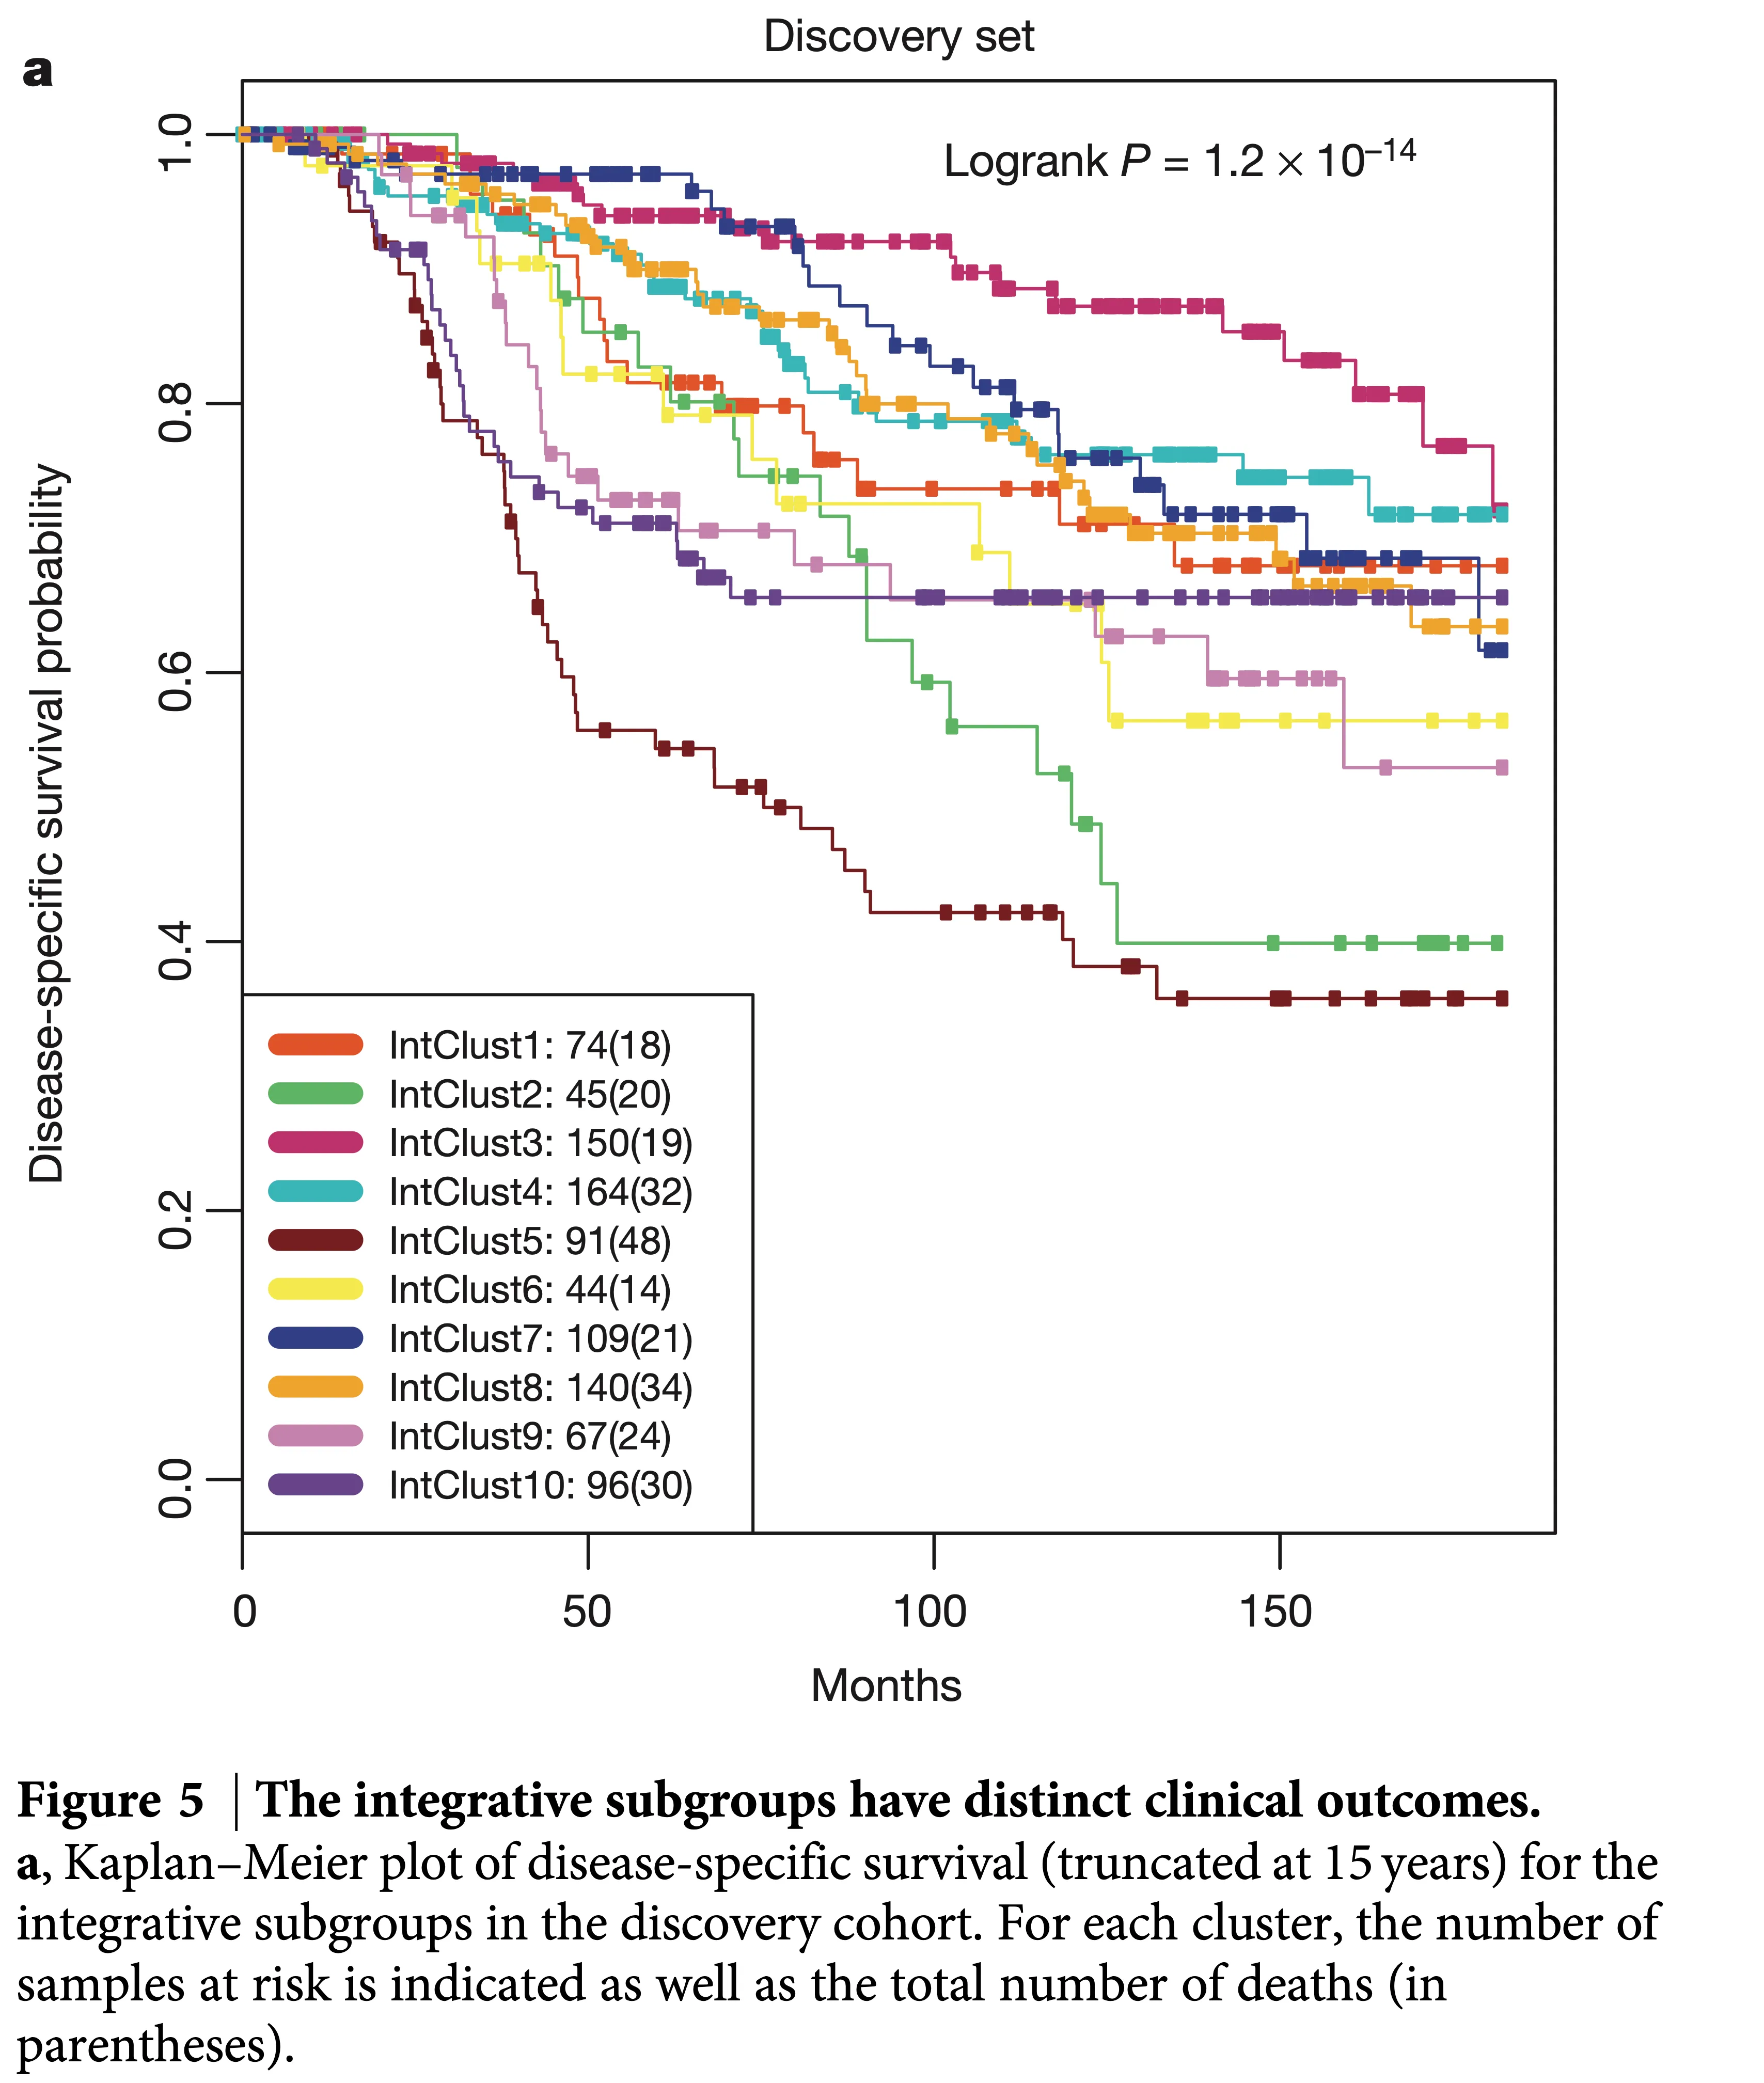
- Gene expression between patient samples
- Images
- Really any sets of measurements across samples
- Useful when don’t know what you’re looking for
- But: can be gibberish
Clustering
- Basic idea: group together similar instances
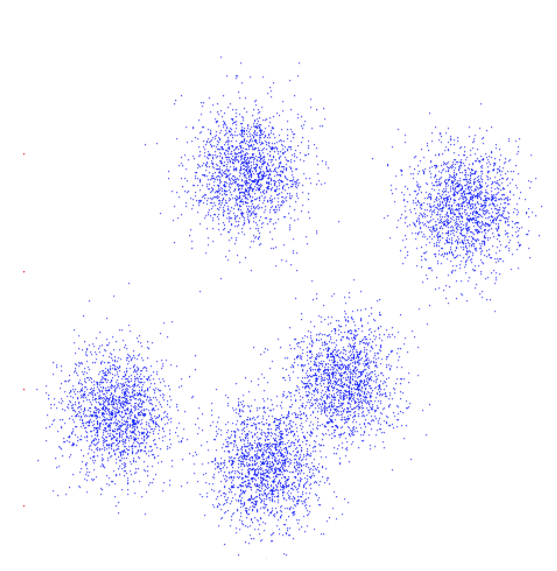
- Example: 2D point patterns

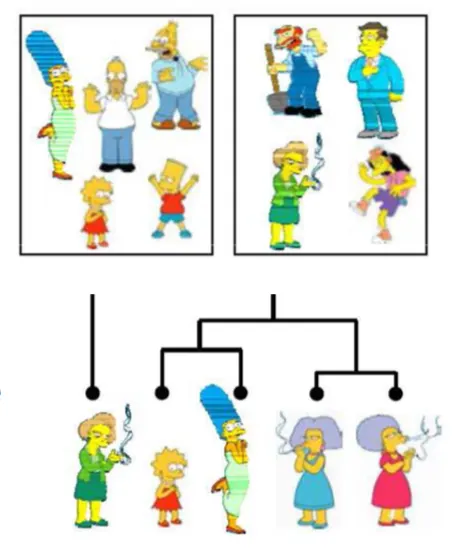
Clustering is subjective!
Applications
- Clustering patients into groups based on molecular or etiological measurements
- Cells into groups based on molecular measurements
- Neuronal signals
What does “similar” mean?
What does “similar” mean?
- One option: Euclidean distance
\[ \textrm{dist}(\mathbf{x}, \mathbf{y}) = \lVert \mathbf{x} - \mathbf{y} \rVert \]
- Clustering results are completely dependent on the measure of similarity (or distance) between observations to be clustered
What properties should a distance measure have?
Symmetric
- \(D(A, B) = D(B, A)\)
- Otherwise we can say
Alooks likeBbut not vice versa
Positivity and self-similarity
- \(D(A,B) > 0\), and \(D(A,B)=0\) iff \(A=B\)
- Otherwise there will be objects that we can’t tell apart
Triangle inequality
- \(D(A, B) + D(B, C) \geq D(A,C)\)
- Otherwise one can say “
AlikeB,BlikeC, butAnot likeCat all”
Clustering algorithms
- Partition algorithms (flat)
- K-means
- Gaussian mixtures
- Hierarchical algorithms
- Bottom up - agglomerative
- Top down - divisive
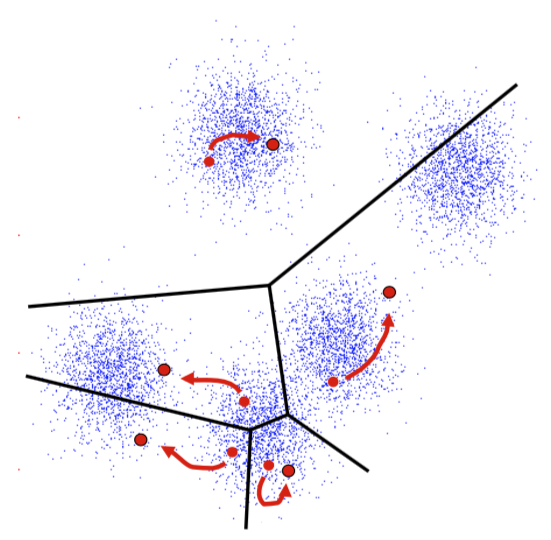
K-means, an iterative clustering algorithm
- Initialize: Pick K random points as cluster centers
- Alternate until no assignments change:
- Assign data points to the closest cluster center
- Change the cluster center to the average of its assigned points
K-means, an iterative clustering algorithm
- Initialize: Pick K random points as cluster centers
- Alternate until no assignments change:
- Assign data points to the closest cluster center
- Change the cluster center to the average of its assigned points
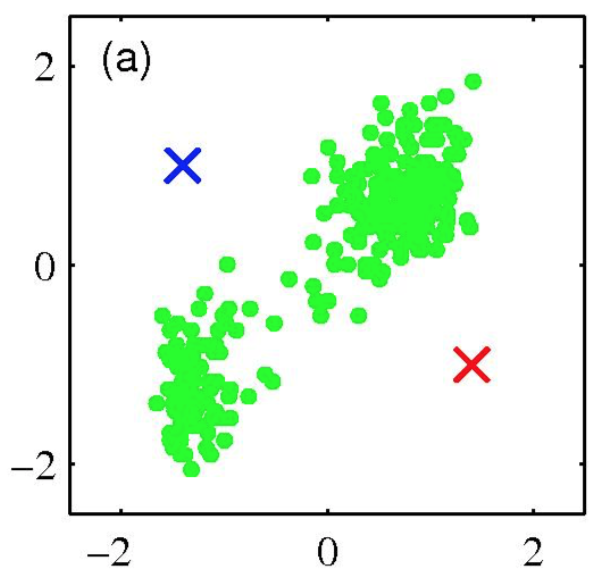
K-means clustering: Example
- Pick K random points as cluster centers (means)
- Shown here for K=2
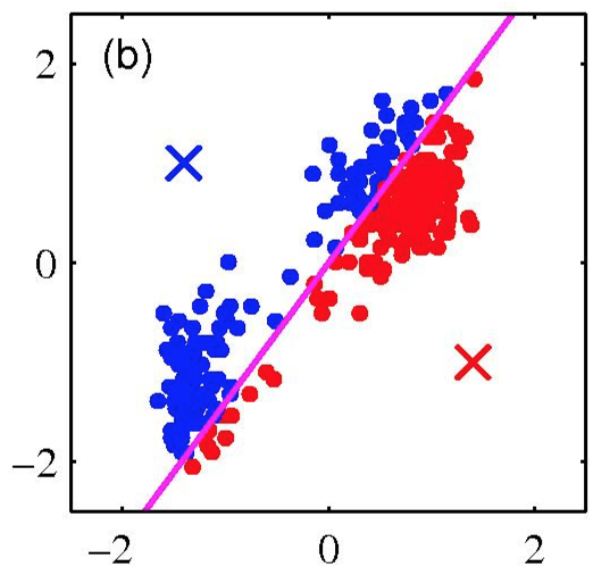
K-means clustering: Example
Iterative Step 1
Assign data points to the closest cluster center
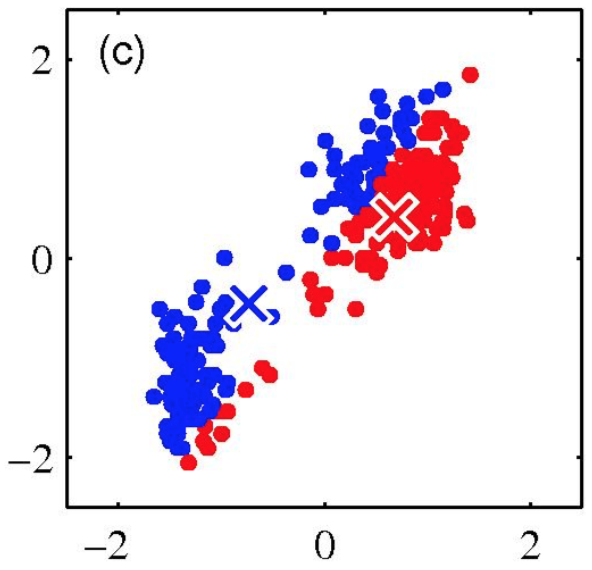
K-means clustering: Example
Iterative Step 2
Change the cluster center to the average of the assigned points
K-means clustering: Example
Repeat until convergence
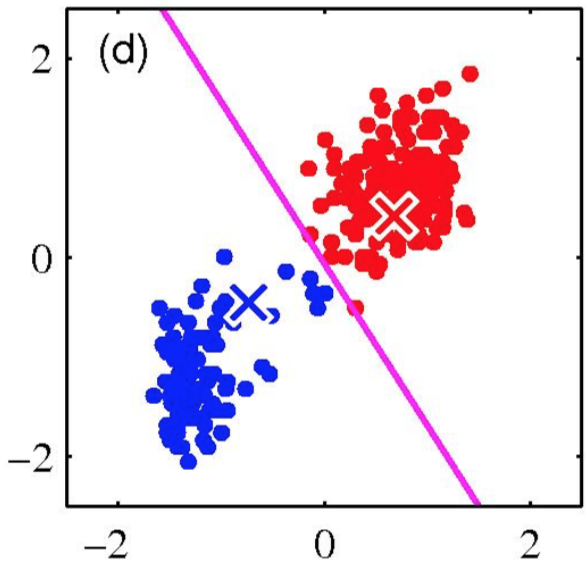
K-means clustering: Example
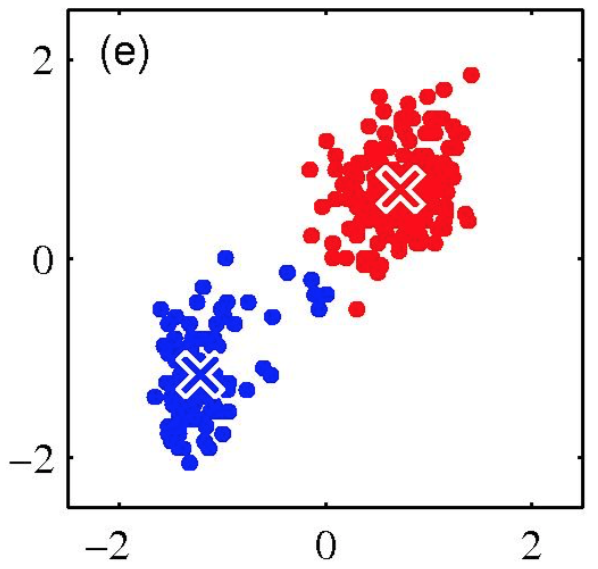
K-means clustering: Example
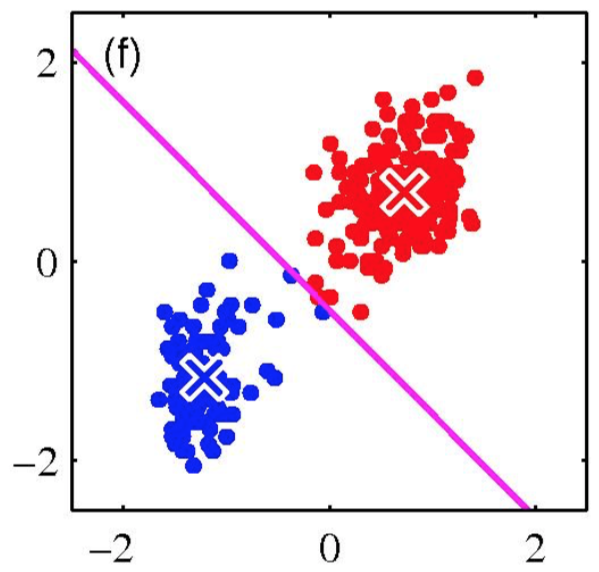
An example
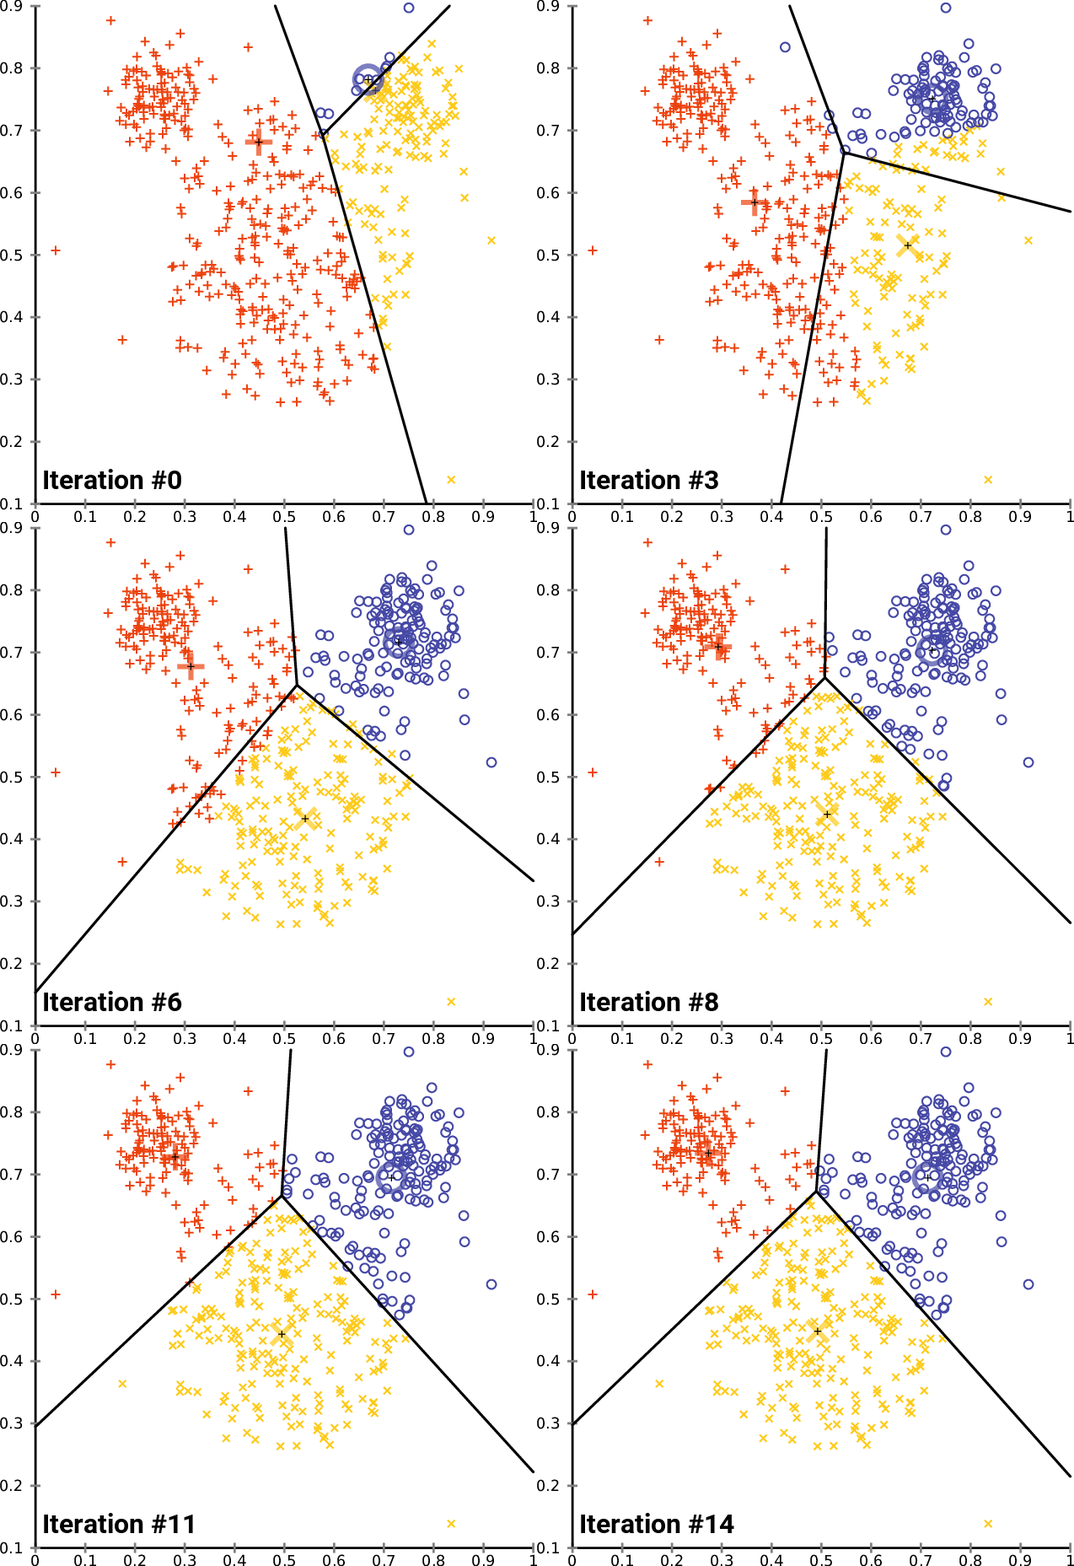
https://commons.wikimedia.org/wiki/User:Chire
Properties of K-means algorithm
- Guaranteed to converge in a finite number of iterations
- Running time per iteration:
- Assign data points to the closest cluster center:
- O(KN) time
- Change the cluster center to the average of its assigned points:
- O(N) time
- Assign data points to the closest cluster center:
K-Means convergence
Objective: \(\min_{\mu}\min_{C}\sum_{i=1}^k \sum_{x\in C_i} \lVert x - \mu_i \rVert^2\)
- Fix \(\mu\), optimize \(C\): \[\min_C \sum_{i=1}^k \sum_{x\in C_i} \lVert x - \mu_i \rVert^2 = \min_C \sum_{i}^n \lVert x_i - \mu_{x_i} \rVert^2\]
- Fix \(C\), optimize \(\mu\): \[\min_{\mu}\sum_{i=1}^k \sum_{x\in C_i} \lVert x - \mu_i \rVert^2\]
- Take partial derivative of \(\mu_i\) and set to zero, we have \[\mu_i = \frac{1}{\lVert C_i \rVert} \sum_{x \in C_i} x\]
Kmeans takes an alternating optimization approach. Each step is guaranteed to decrease the objective—thus guaranteed to converge.
K-means is (somewhat) sensitive to initialization
- Various heuristic schemes exist for preventing problematic results.
- None of them are perfect.
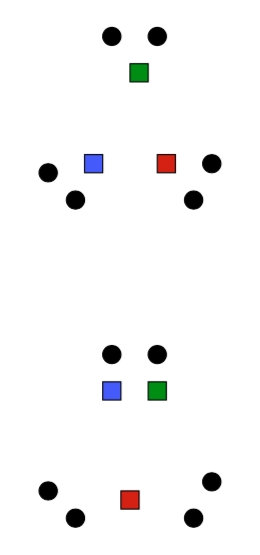
K-Means Getting Stuck
Local optima dependent on how the problem was specified:
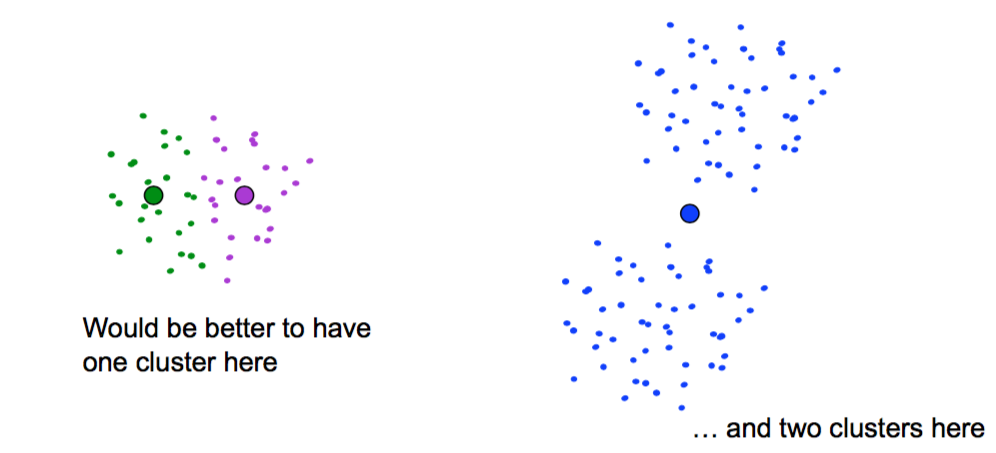
K-means not able to properly cluster

Changing the features (distance function) can help
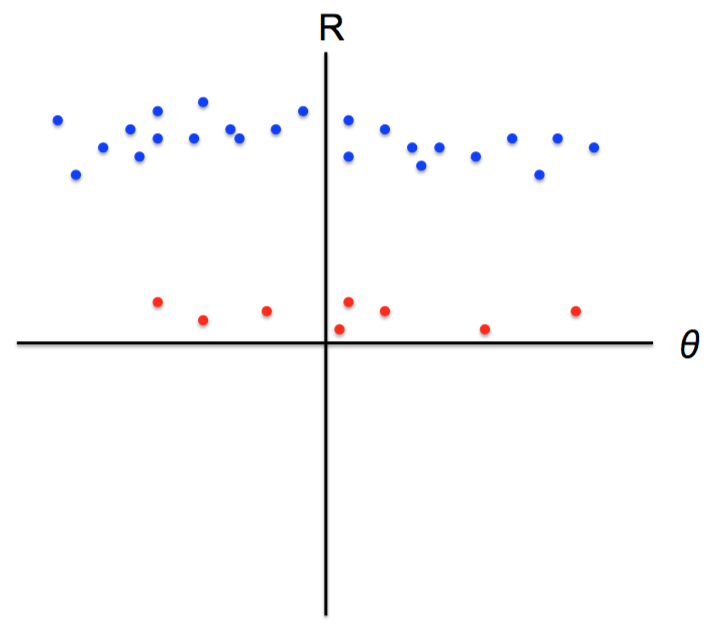
Agglomerative Clustering
Agglomerative Clustering
- Agglomerative clustering:
- First merge very similar instances
- Incrementally build larger clusters out of smaller clusters
- Algorithm:
- Maintain a set of clusters
- Initially, each instance in its own cluster
- Repeat:
- Pick the two closest clusters
- Merge them into a new cluster
- Stop when there’s only one cluster left
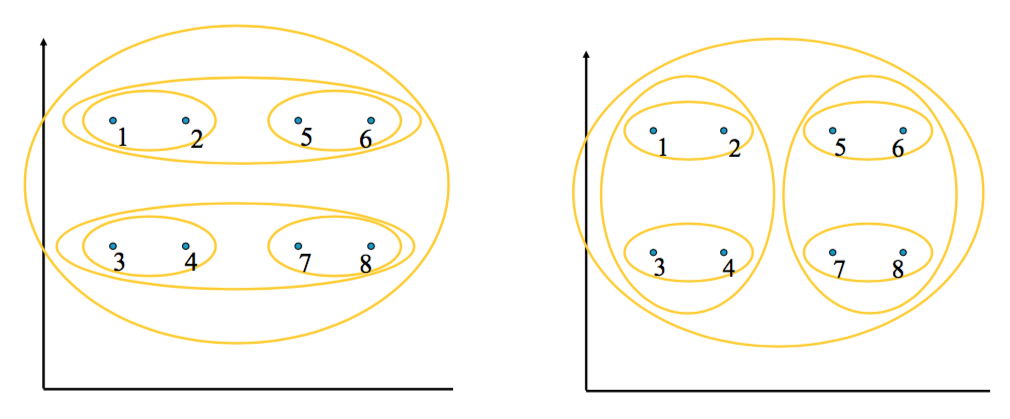
- Produces not one clustering, but a family of clusterings represented by a dendrogram
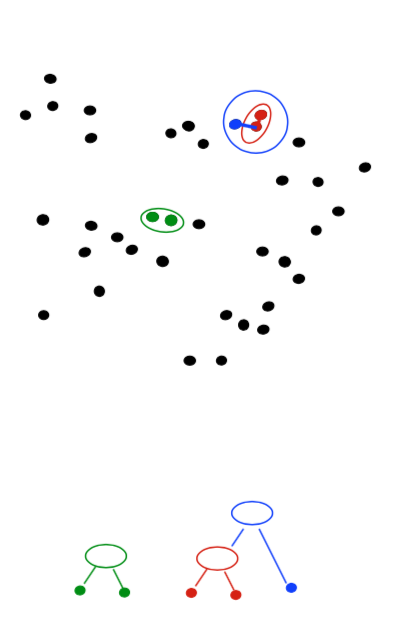
Agglomerative Clustering
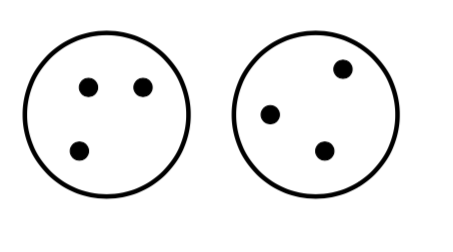
How should we define “closest” for clusters with multiple elements?
Agglomerative Clustering
- How should we define “closest” for clusters with multiple elements?
- Many options:
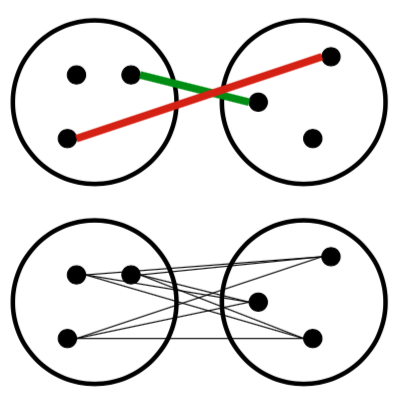
- Closest pair (single-link clustering)
- Farthest pair (complete-link clustering)
- Average of all pairs
- Different choices create different clustering behaviors
Agglomerative Clustering
- How should we define “closest” for clusters with multiple elements?
- Many options:
- Closest pair (left)
- Farthest pair (right)
- Average of all pairs
- Different choices create different clustering behaviors
Clustering Behavior
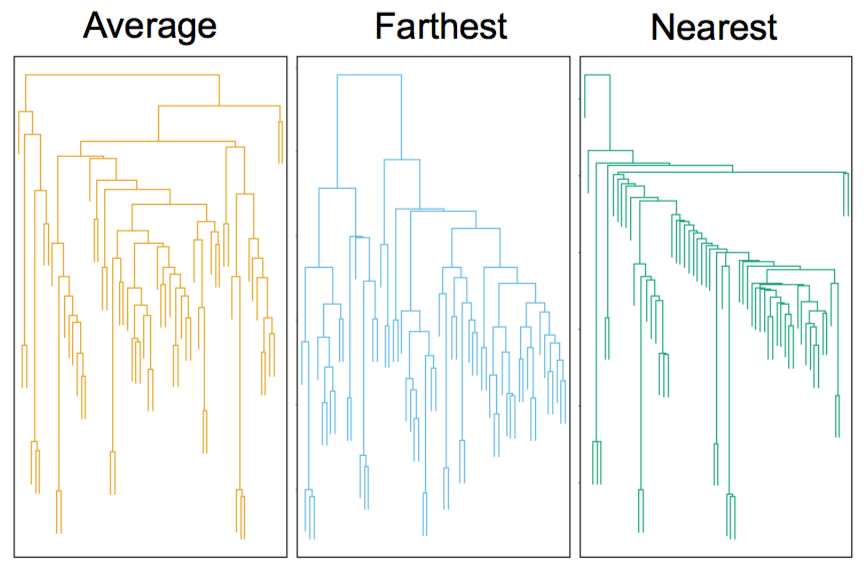
Mouse tumor data from Hastie et al.
Agglomerative Clustering Questions
- Will agglomerative clustering converge?
- To a global optimum?
- Will it always find the true patterns in the data?
- Do people ever use it?
- How many clusters to pick?
Reconsidering “hard assignments”?
- Clusters may overlap
- Some clusters may be “wider” than others
- Distances can be deceiving!
Review
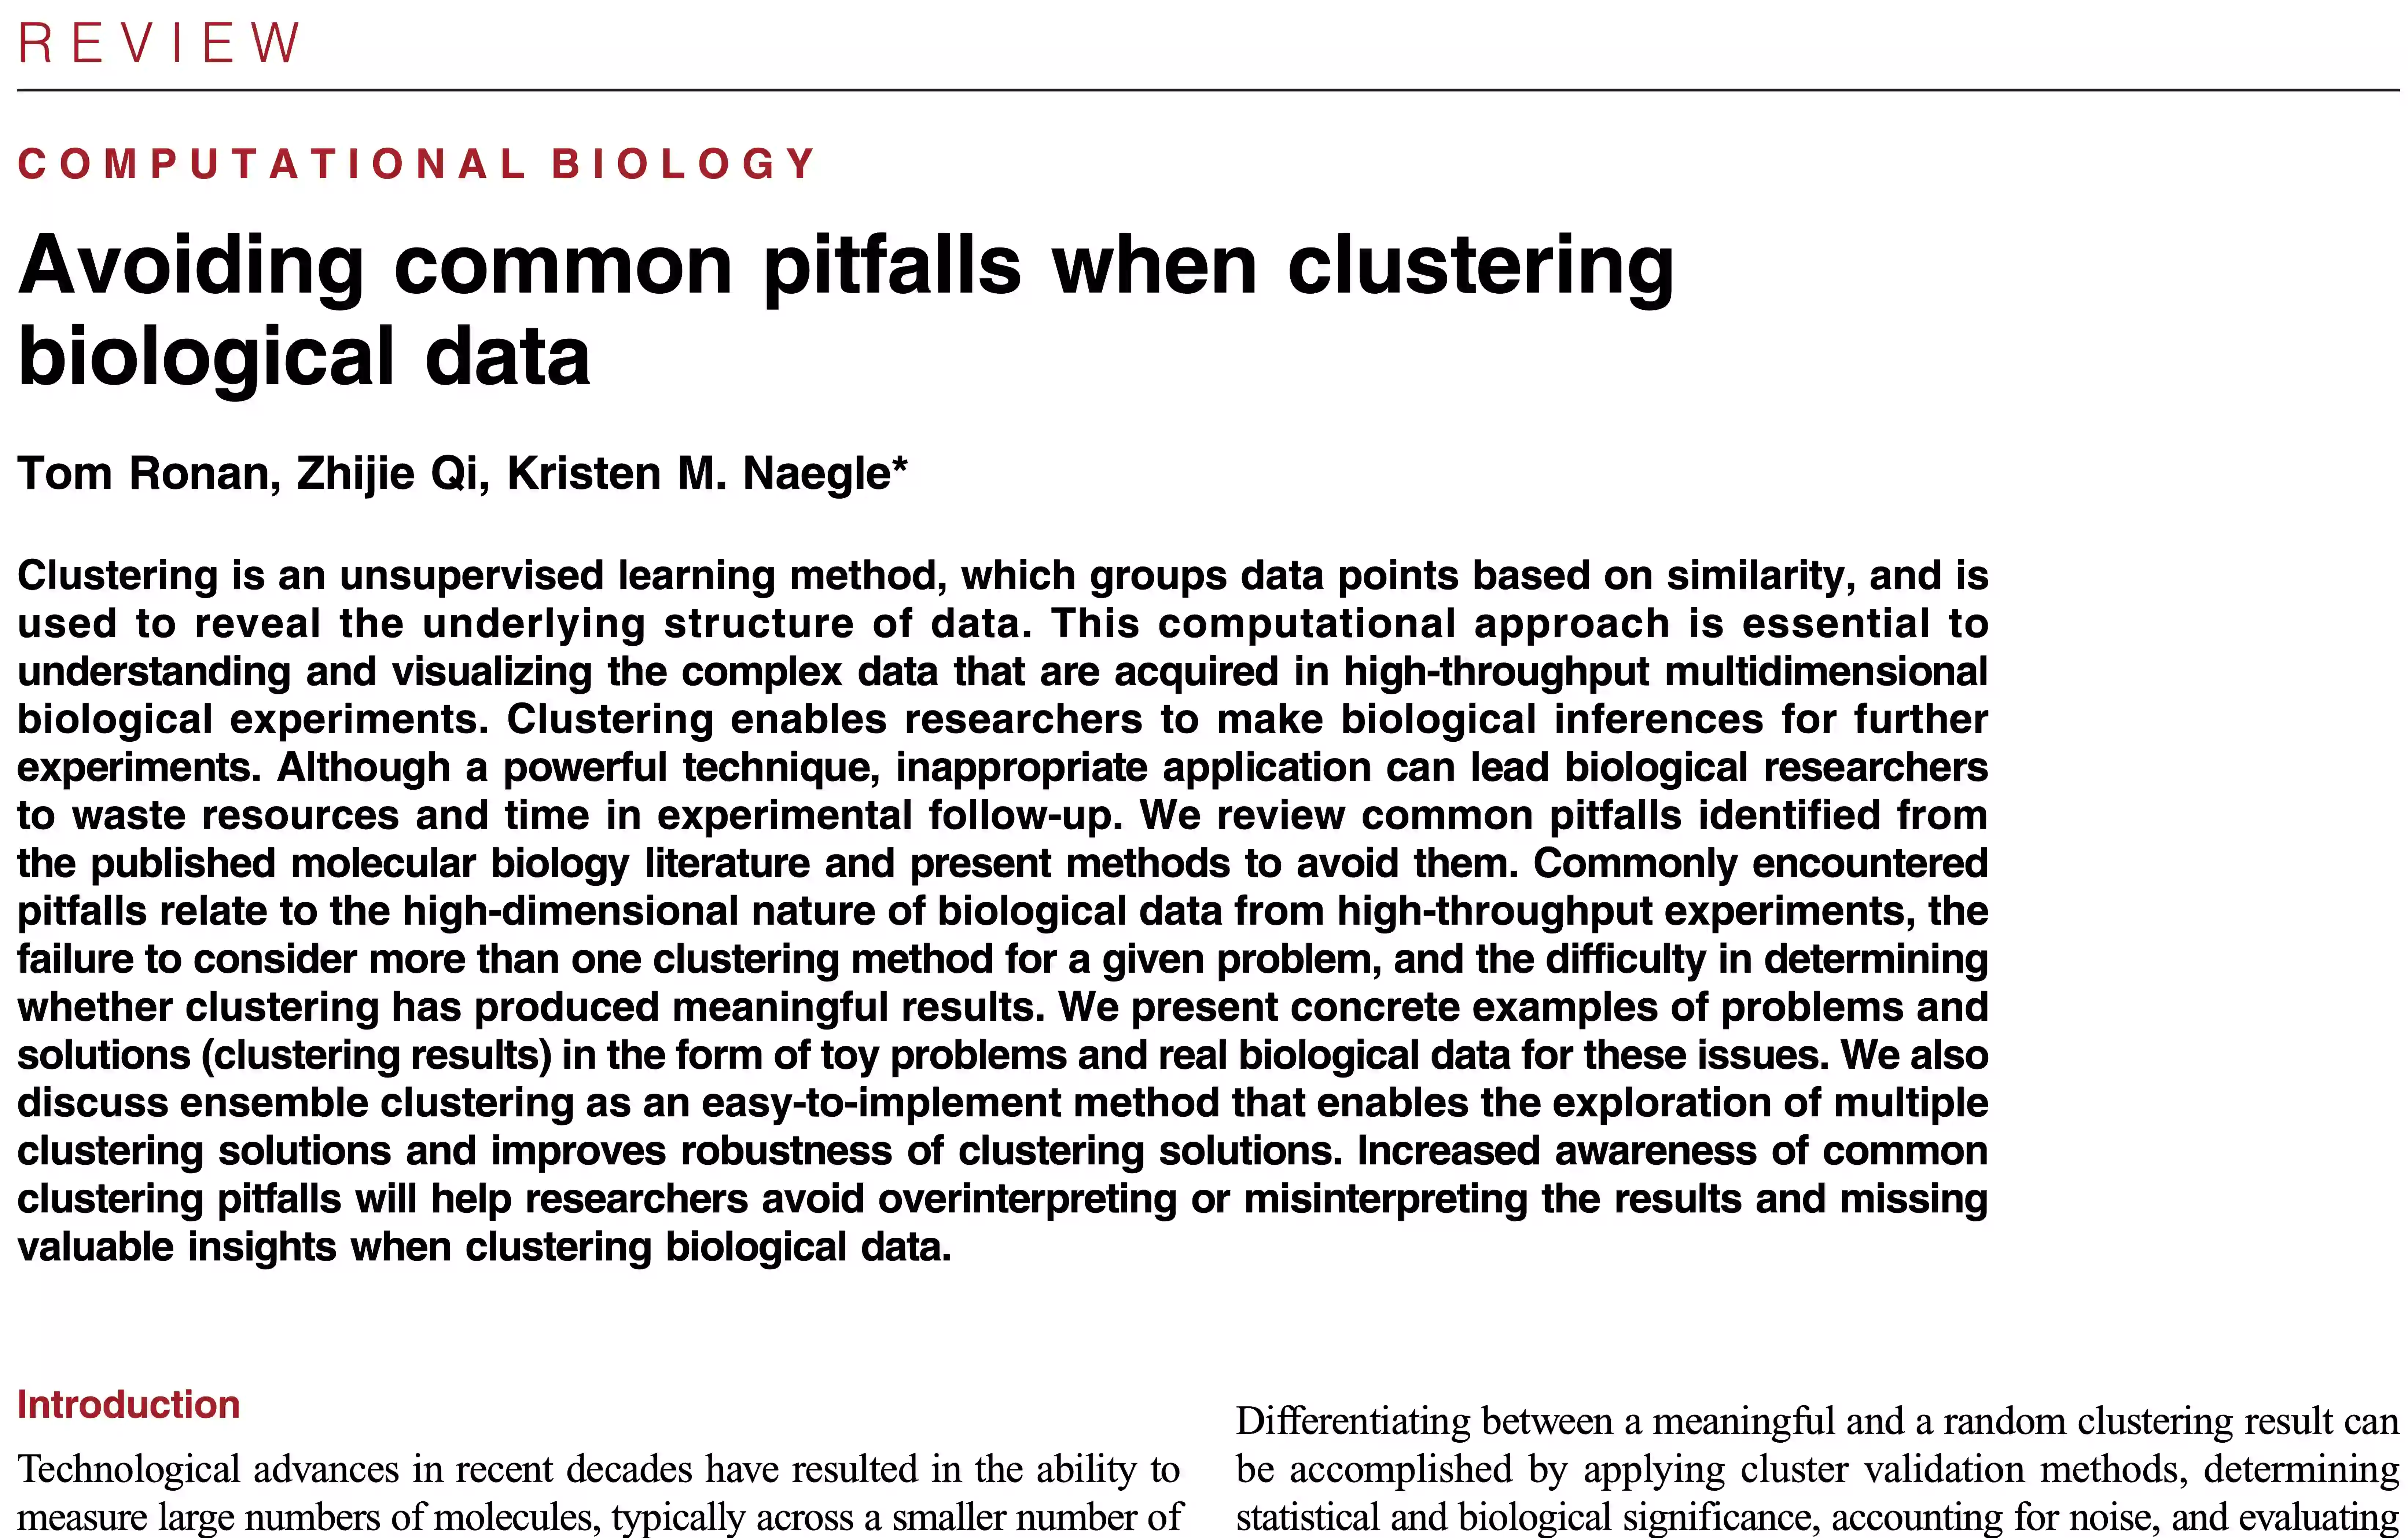
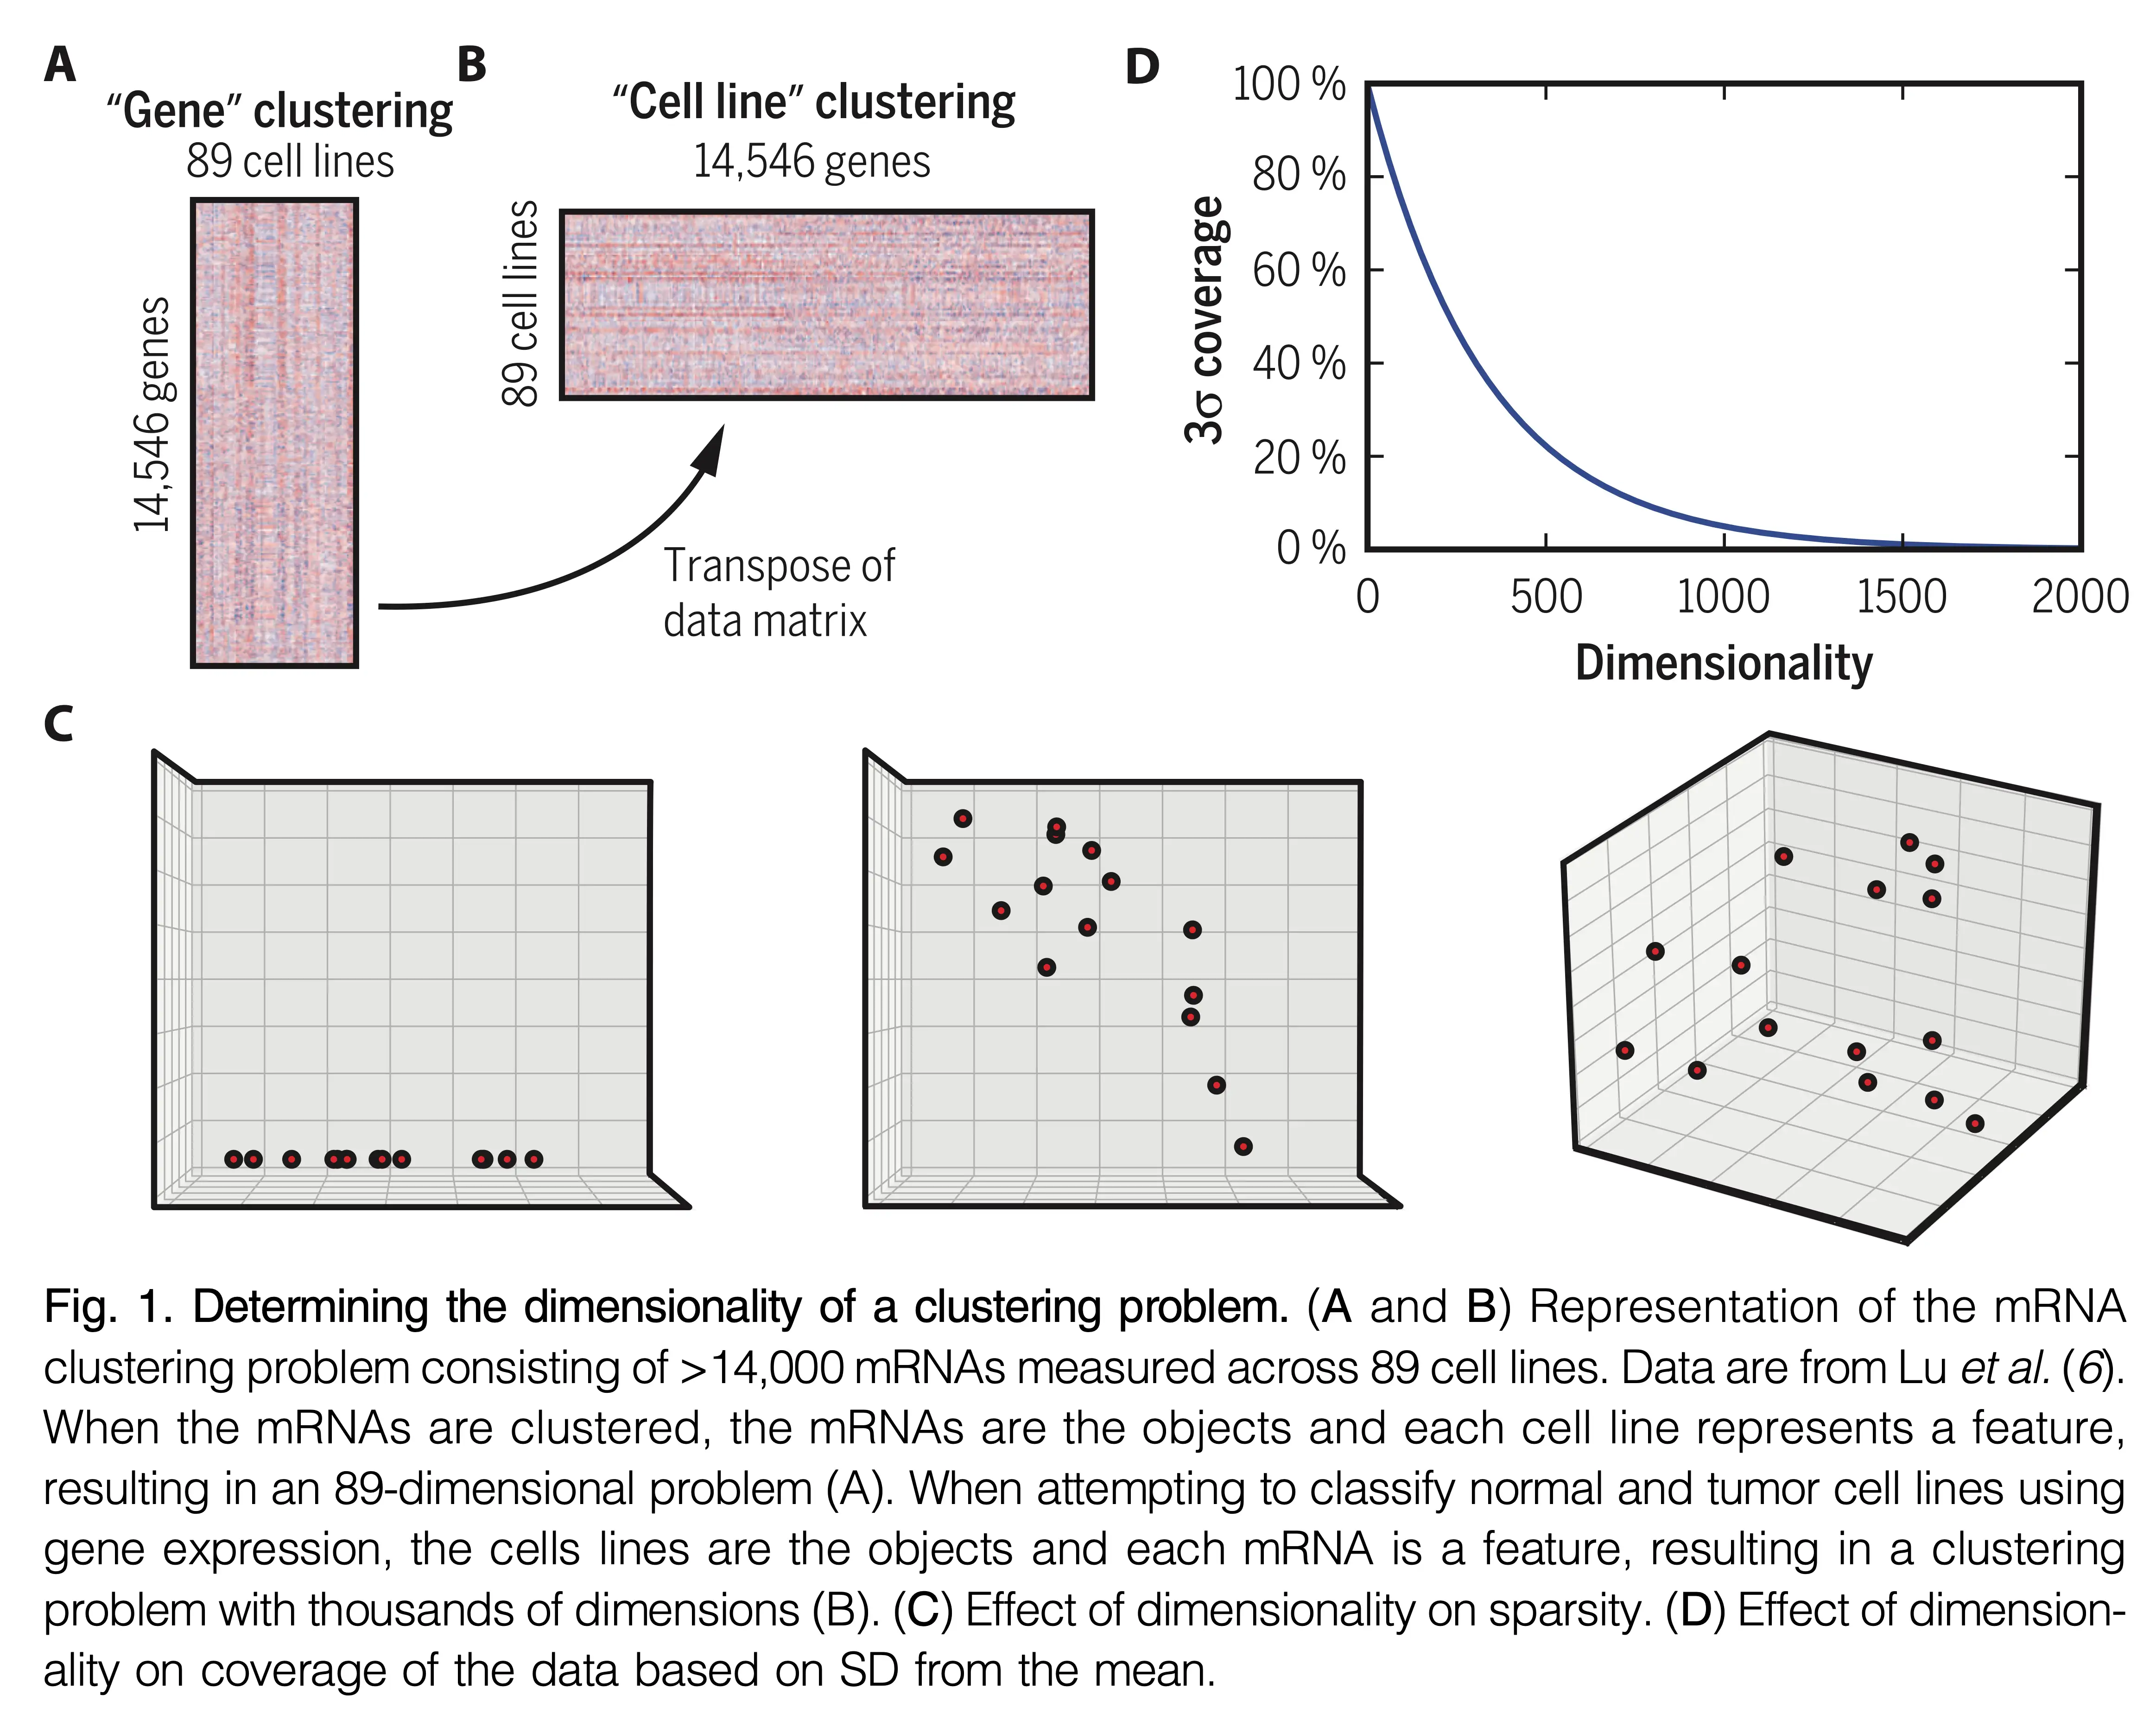
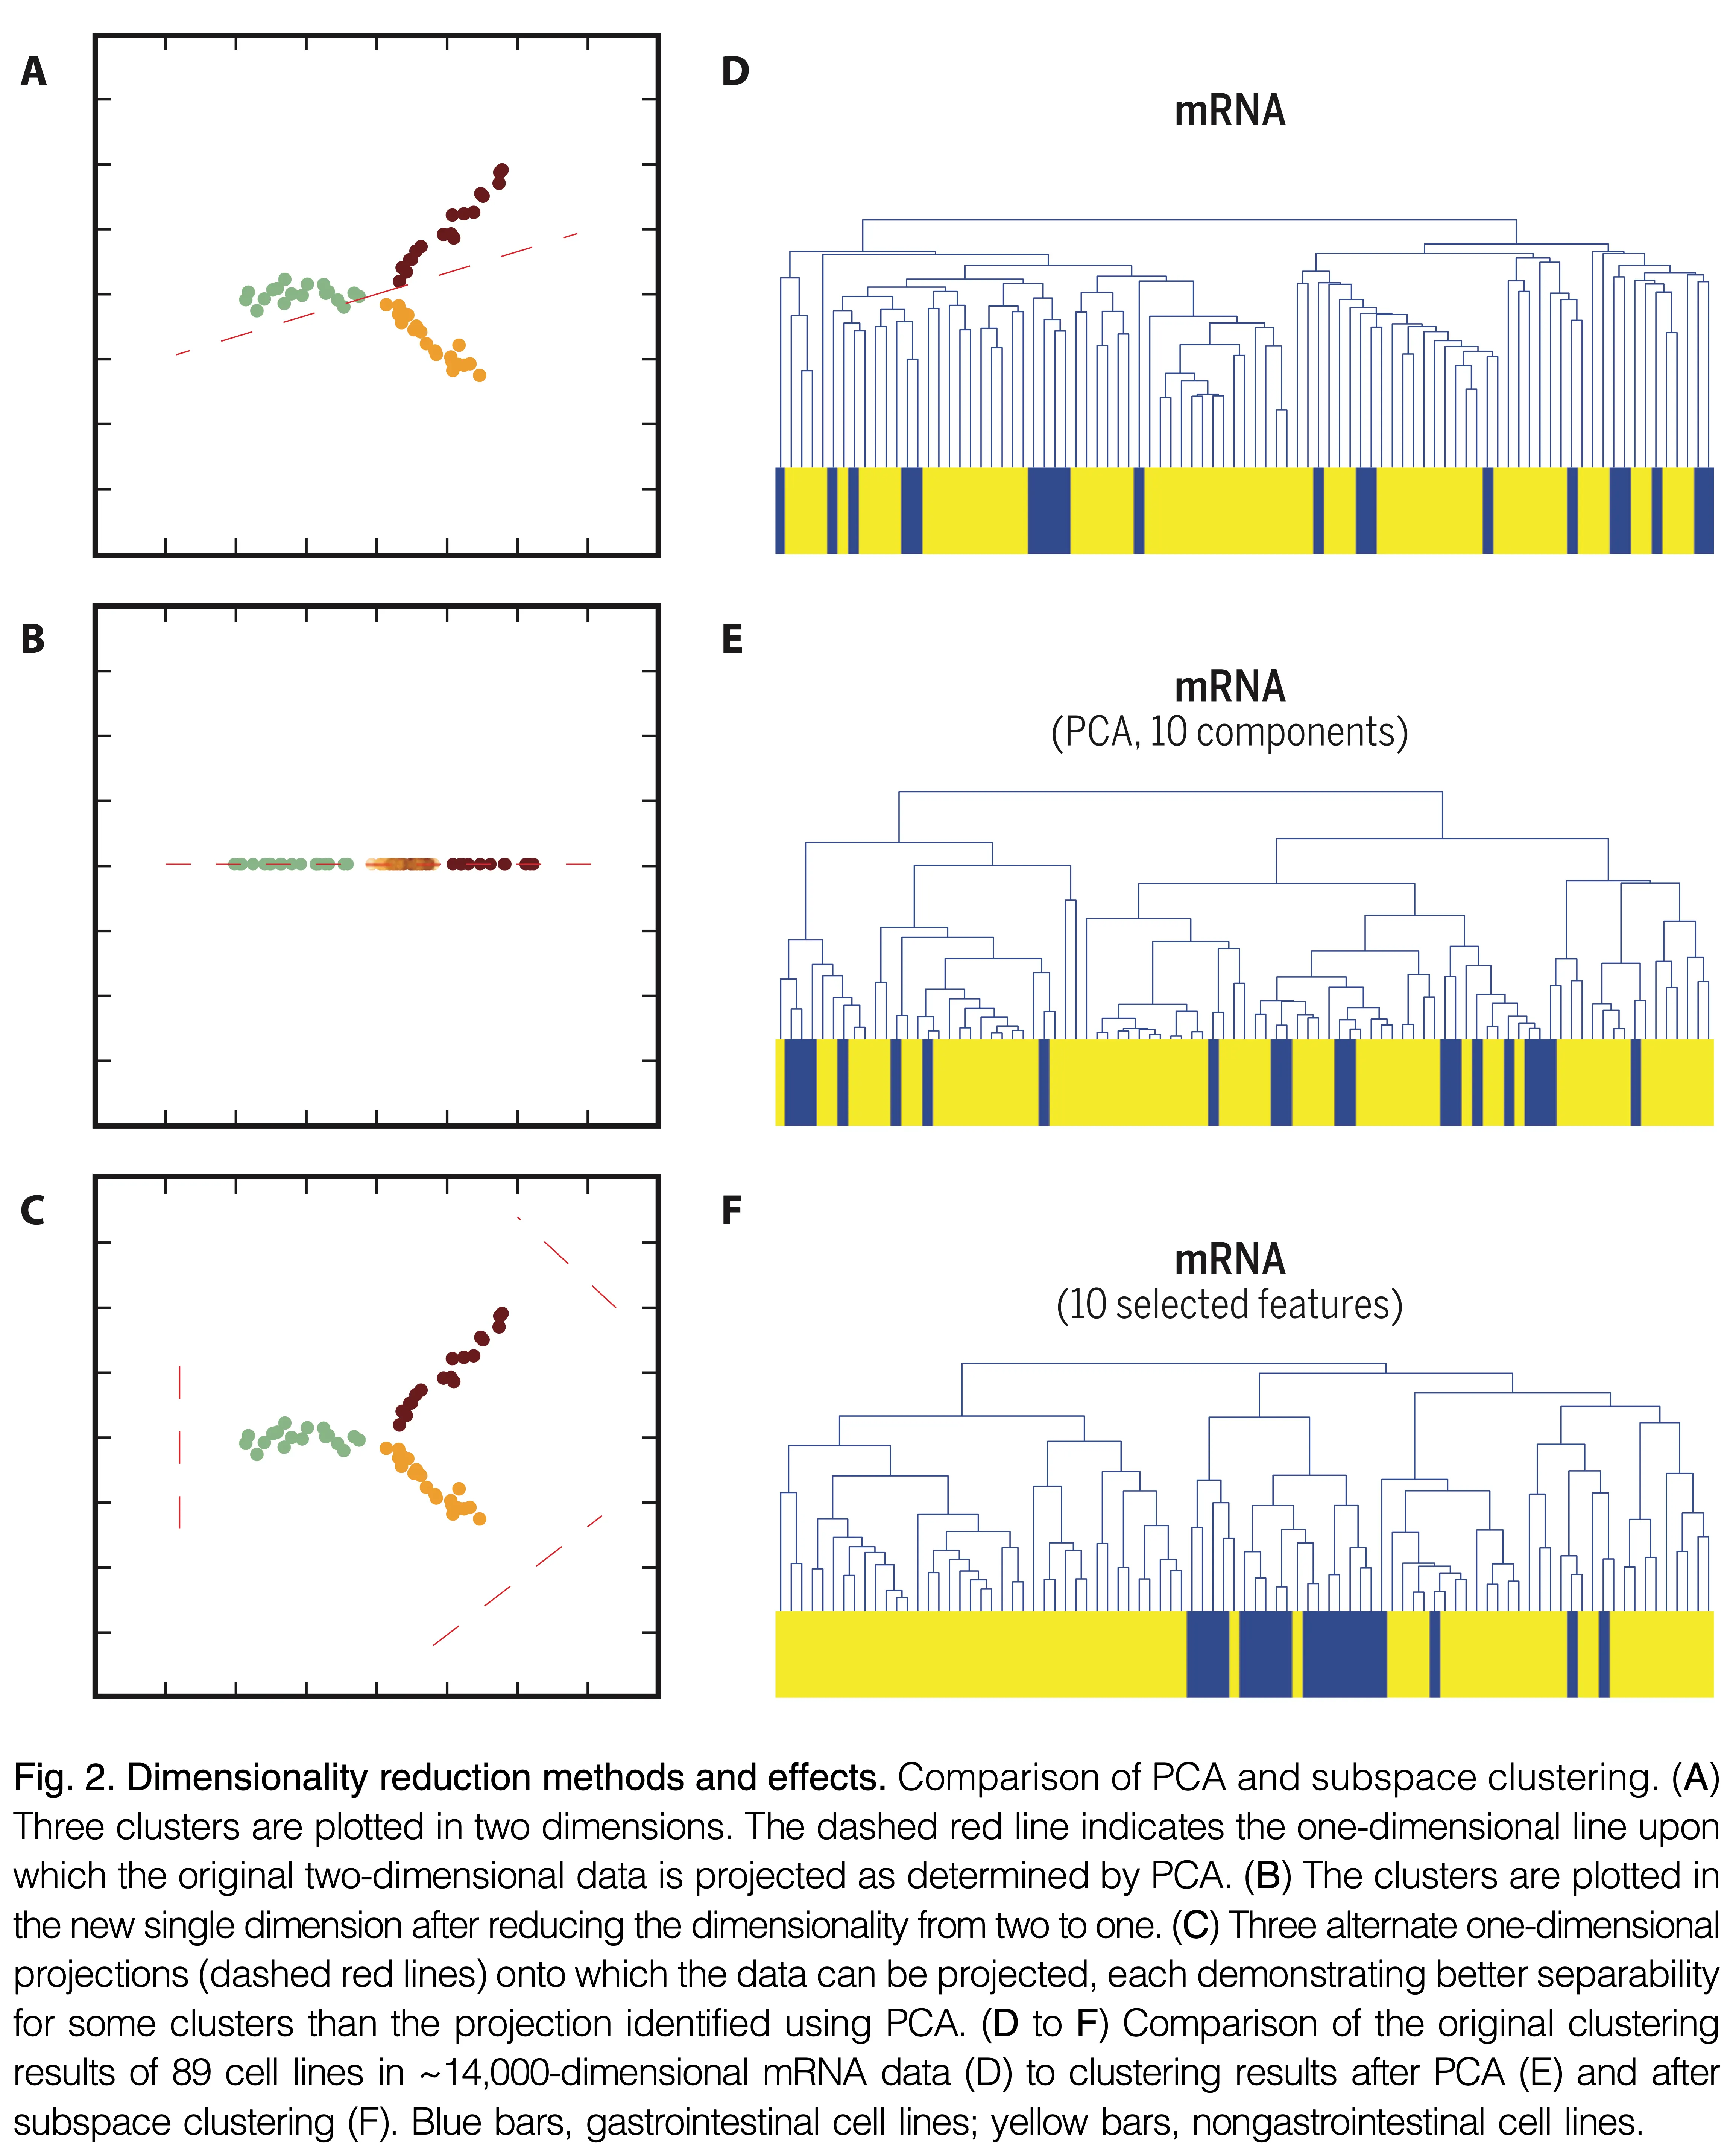
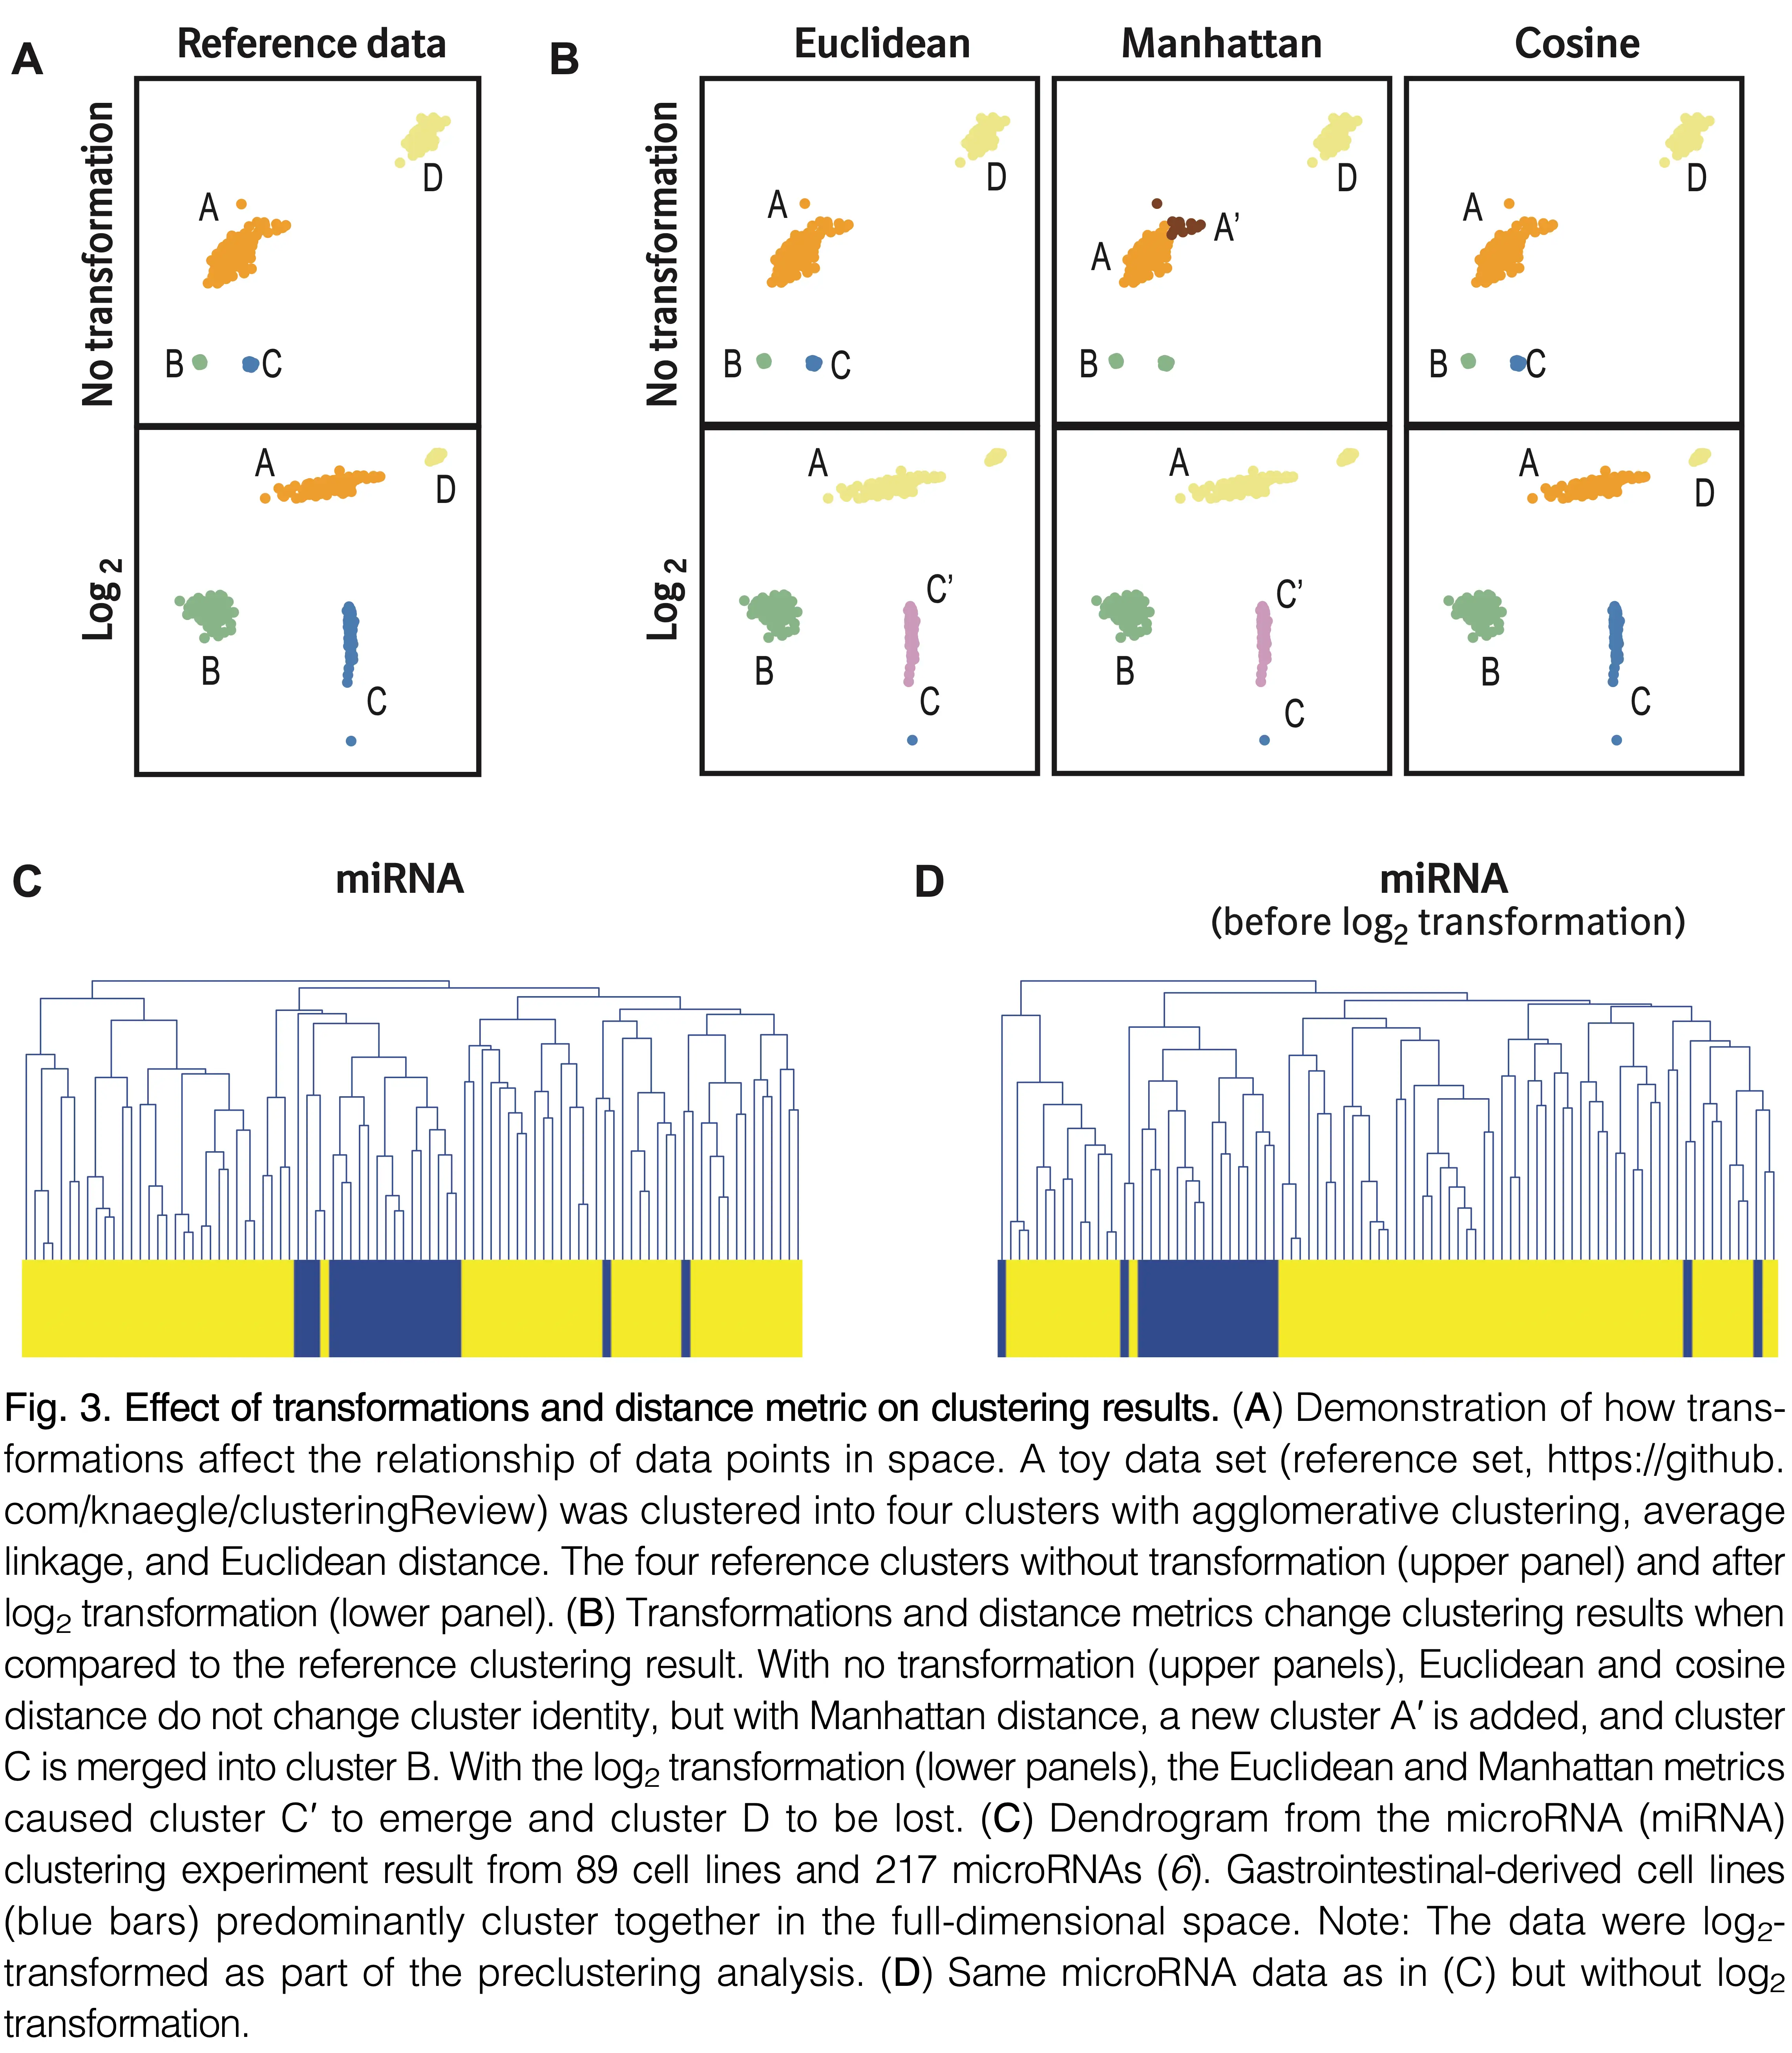
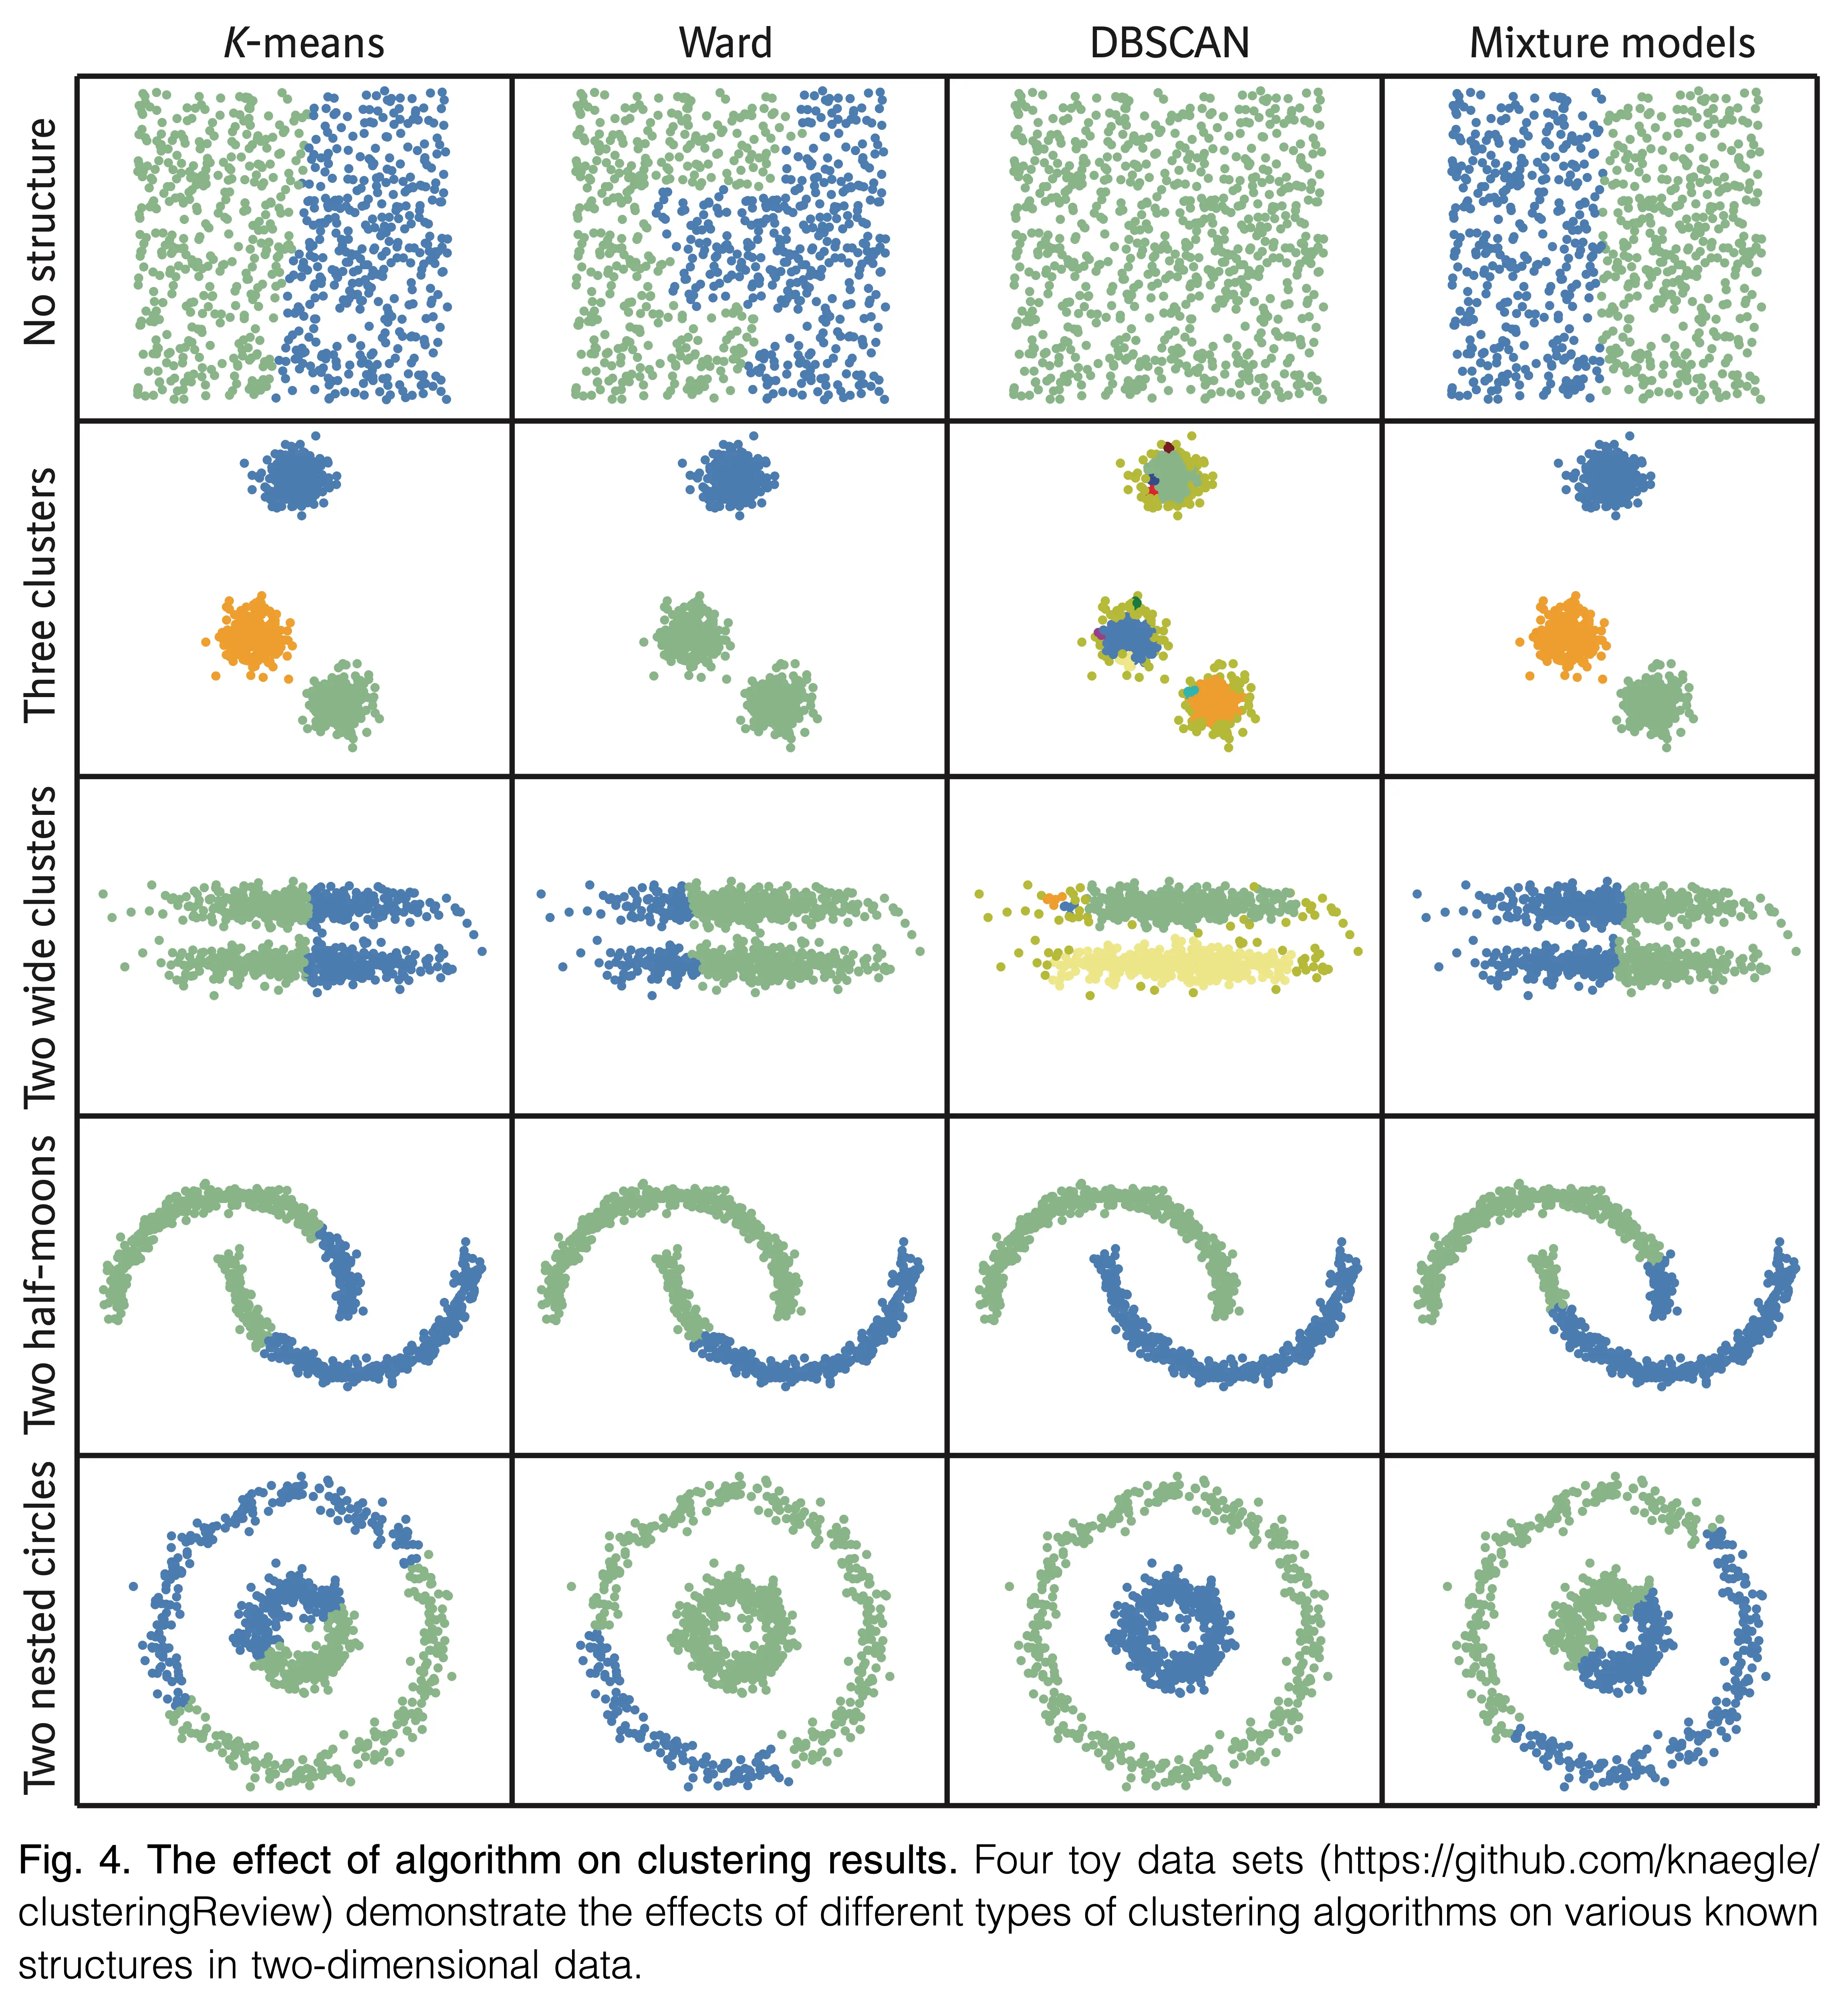
Implementation
K-means
n_clusters: Number of clusters to forminit: Initialization methodn_init: Number of initializationsmax_iter: Maximum steps algorithm can take
Agglomerative
sklearn.cluster.AgglomerativeClustering
n_clusters: Number of clusters to returnmetric: Distance metric to uselinkage: Linkage metric to use
Fisher’s iris dataset
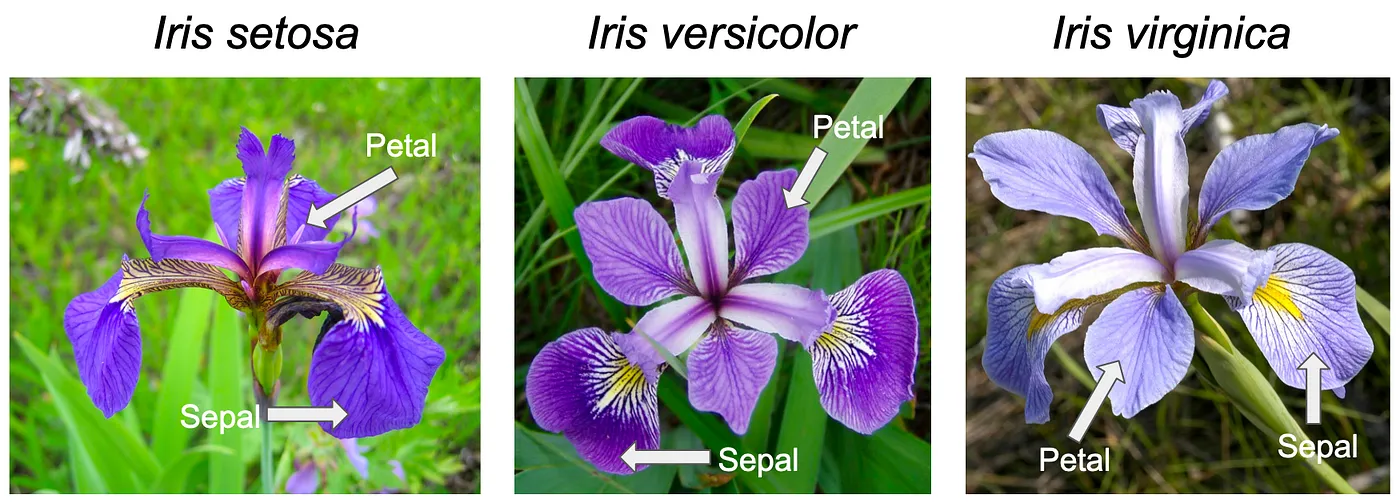
https://en.wikipedia.org/wiki/Iris_flower_data_set
K-means implementation
Review
Further Reading
Review Questions
- What is clustering? What does it seek to accomplish?
- What is agglomerative clustering? What does the resulting output look like?
- What is the difference between single-link, complete-link, and average clustering?
- What are three properties that are required of a distance metric? What kind of things can be compared with a distance metric?
- What decisions does one have to make before performing k-means clustering?
- Describe the process of fitting that k-means performs.
- You and your colleague each run k-means with the same settings, and arrive at different results. How could this happen?
- What are two cases in which k-means clustering can fail or provide bad results?
- How do you determine that your clustering is “good”?