Clustering
Clustering
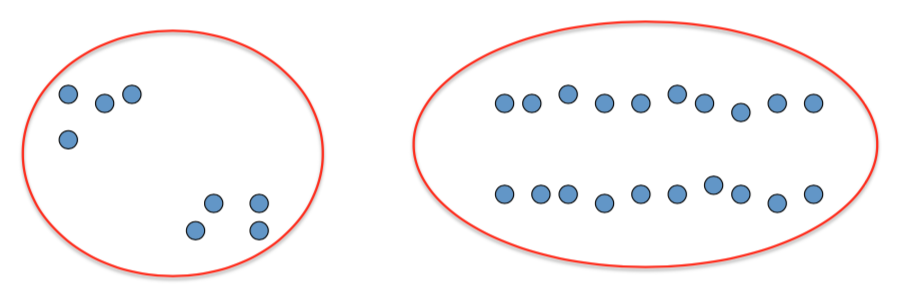
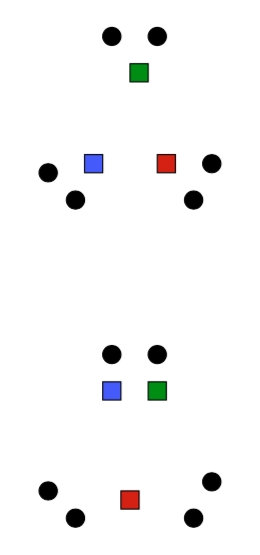
- Basic idea: group together similar instances
- Example: 2D point patterns

Clustering algorithms
- Partition algorithms (flat)
- K-means
- Gaussian mixtures
- Hierarchical algorithms
- Bottom up - agglomerative
- Top down - divisive
K-means, an iterative clustering algorithm
- Initialize: Pick K random points as cluster centers
- Alternate until no assignments change:
- Assign data points to the closest cluster center
- Change the cluster center to the average of its assigned points
K-means, an iterative clustering algorithm
- Initialize: Pick K random points as cluster centers
- Alternate until no assignments change:
- Assign data points to the closest cluster center
- Change the cluster center to the average of its assigned points
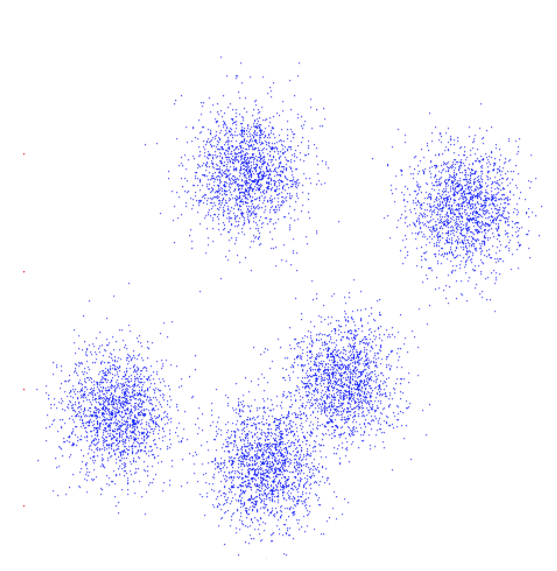
K-means clustering: Example
- Pick K random points as cluster centers (means)
- Shown here for K=2
K-means clustering: Example
Iterative Step 1
Assign data points to the closest cluster center
K-means clustering: Example
Iterative Step 2
Change the cluster center to the average of the assigned points
K-means clustering: Example
Repeat until convergence
K-means clustering: Example
K-means clustering: Example
An example
https://commons.wikimedia.org/wiki/User:Chire
K-means is (somewhat) sensitive to initialization
- Various heuristic schemes exist for preventing problematic results.
- None of them are perfect.
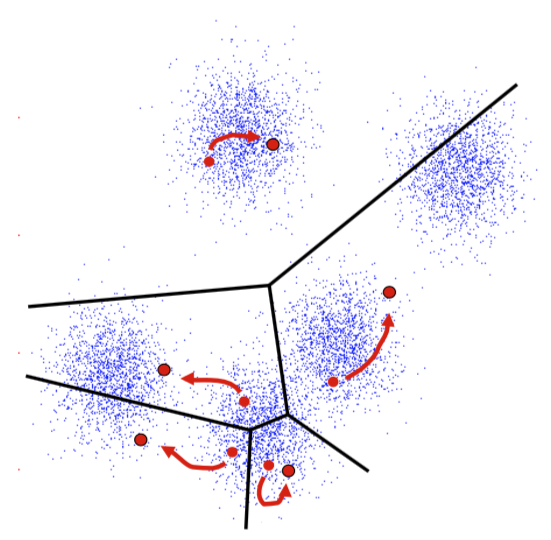
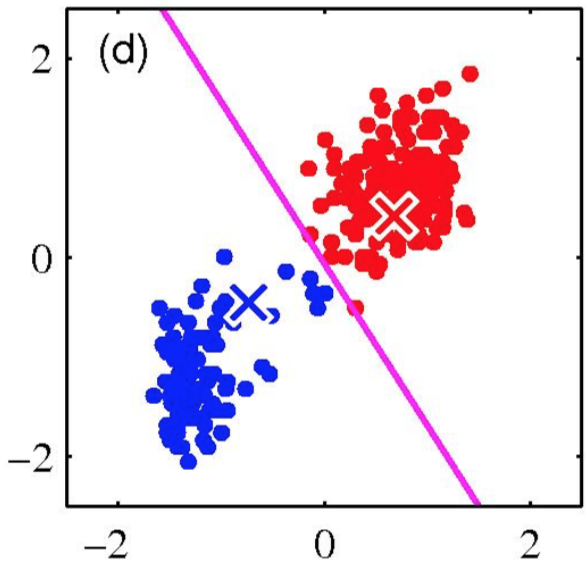
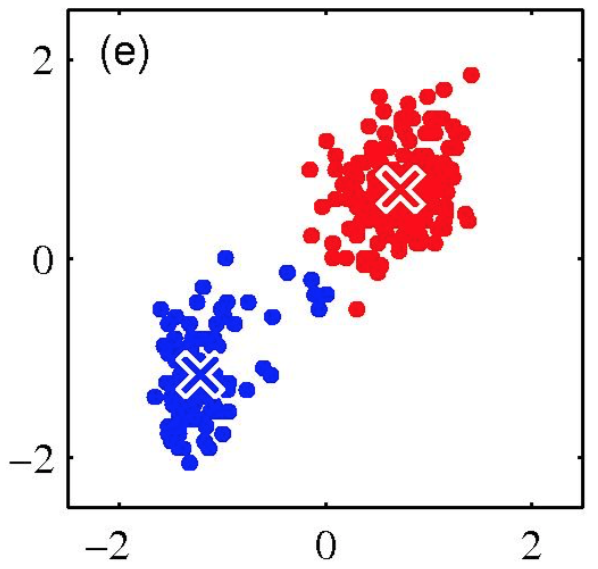
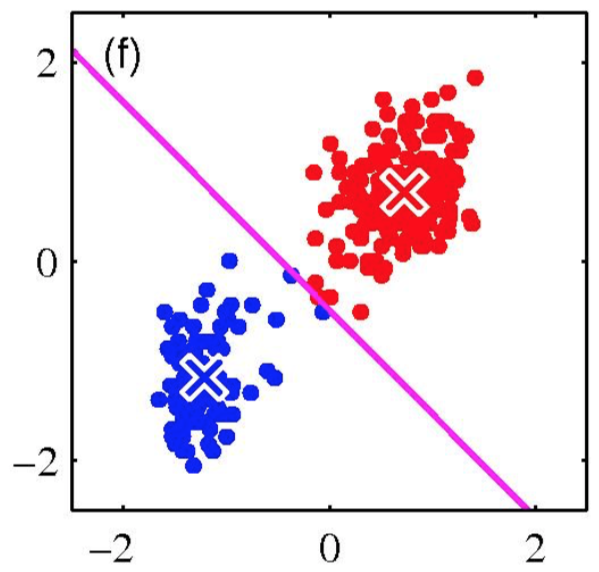
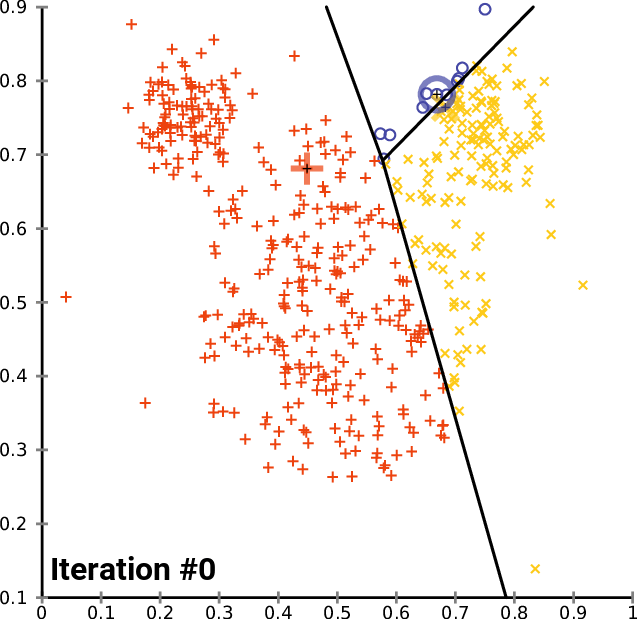
K-Means Getting Stuck
Local optima dependent on how the problem was specified:
K-means not able to properly cluster
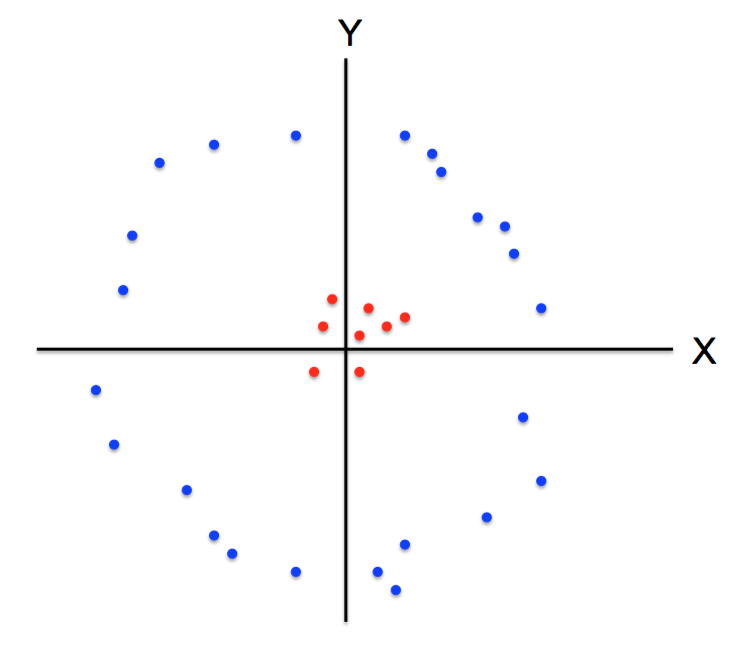
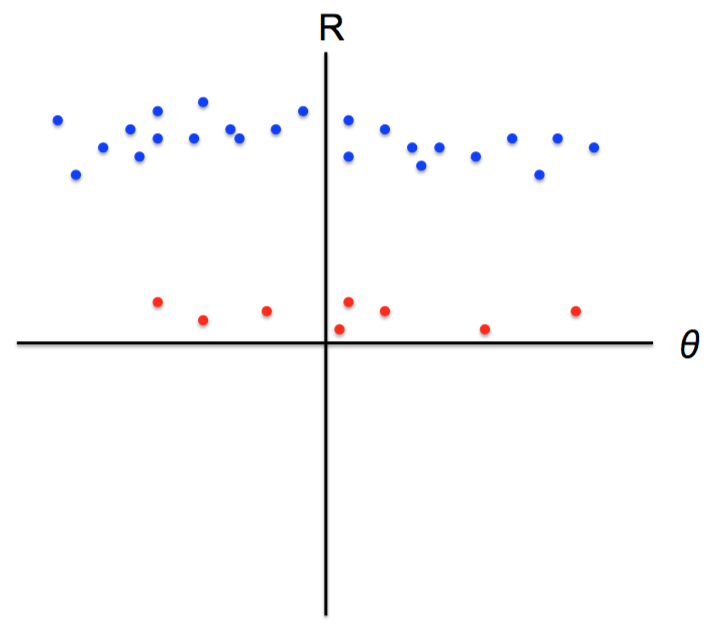
Changing the features (distance function) can help
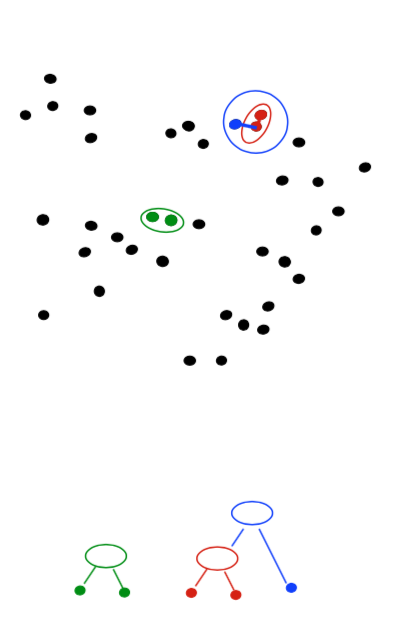
Agglomerative Clustering
- Agglomerative clustering:
- First merge very similar instances
- Incrementally build larger clusters out of smaller clusters
- Algorithm:
- Maintain a set of clusters
- Initially, each instance in its own cluster
- Repeat:
- Pick the two closest clusters
- Merge them into a new cluster
- Stop when there’s only one cluster left
- Produces not one clustering, but a family of clusterings represented by a dendrogram
Agglomerative Clustering
How should we define “closest” for clusters with multiple elements?
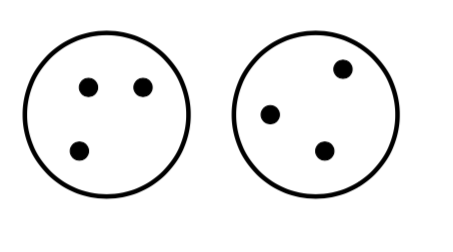
Agglomerative Clustering
- How should we define “closest” for clusters with multiple elements?
- Many options:
- Closest pair (single-link clustering)
- Farthest pair (complete-link clustering)
- Average of all pairs
- Different choices create different clustering behaviors
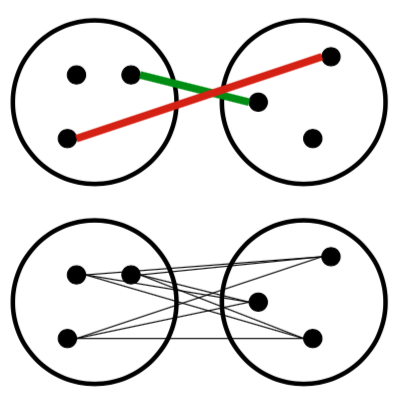
Agglomerative Clustering
- How should we define “closest” for clusters with multiple elements?
- Many options:
- Closest pair (left)
- Farthest pair (right)
- Average of all pairs
- Different choices create different clustering behaviors
Clustering Behavior
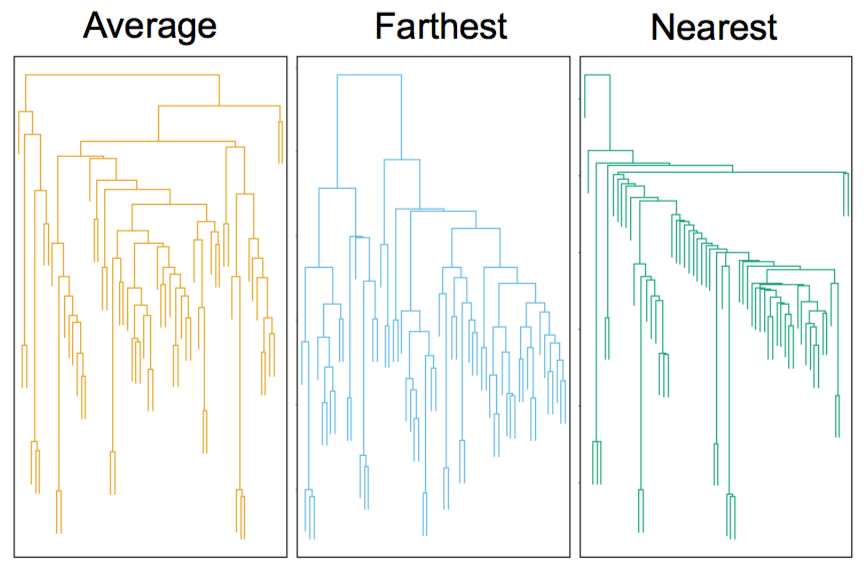
Mouse tumor data from Hastie et al.
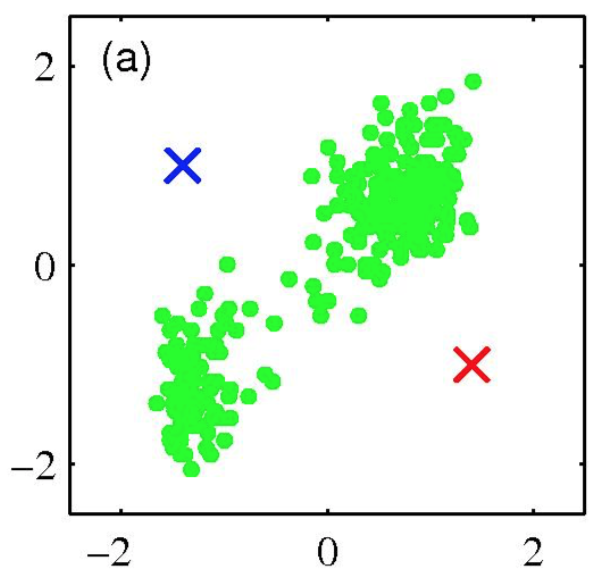
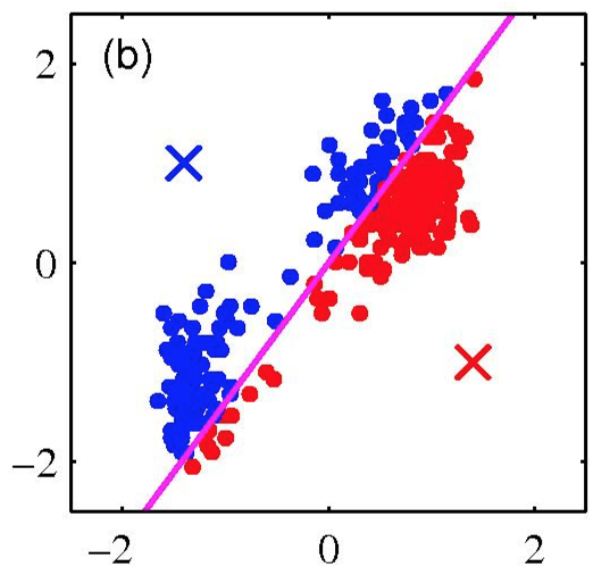
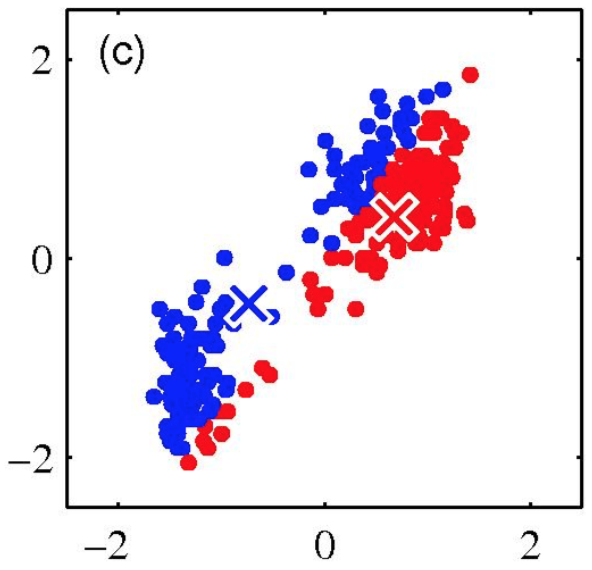
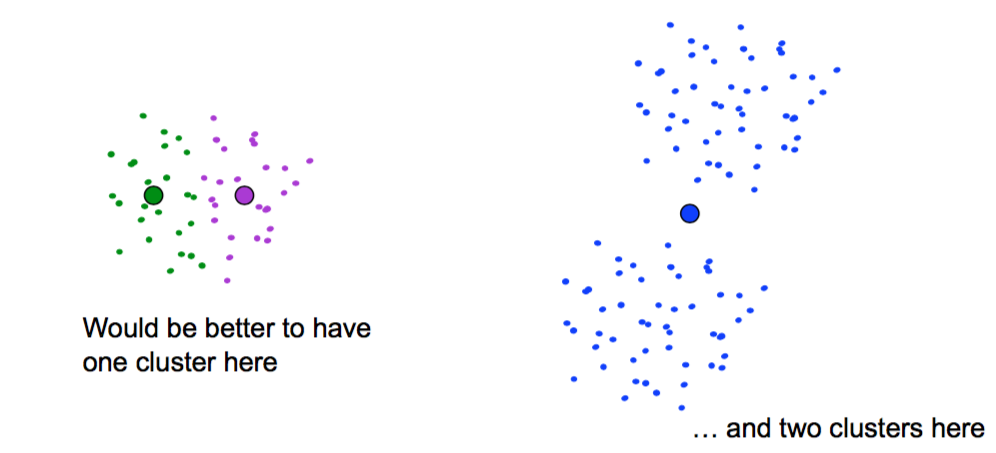
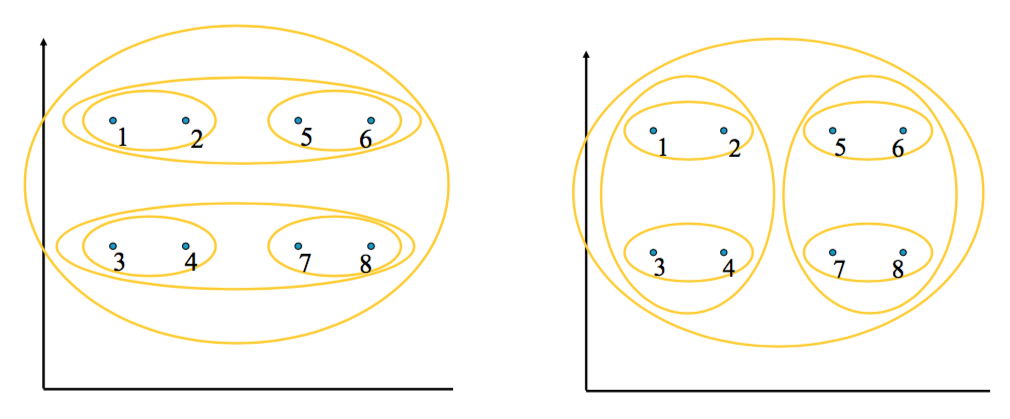
Reconsidering “hard assignments”?
- Clusters may overlap
- Some clusters may be “wider” than others
- Distances can be deceiving!

Review
Fisher’s iris dataset
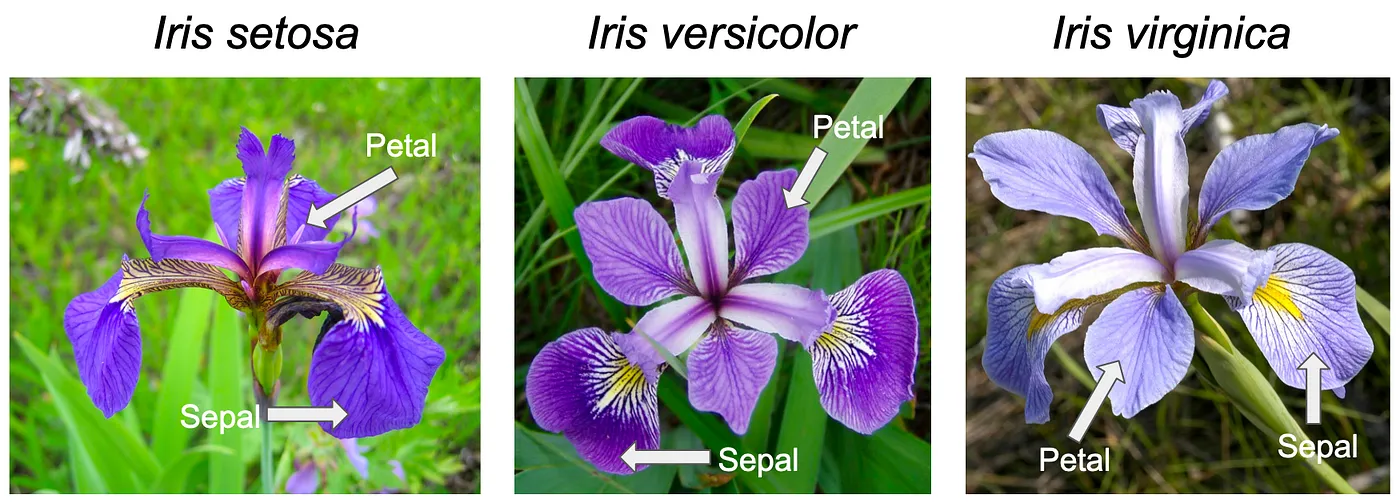
https://en.wikipedia.org/wiki/Iris_flower_data_set

